Parmenion
Pensions
Helping financial advisers plan a client’s retirement income, and explain it, in one tool.
Parmenion is a UK investment platform for financial advisers. More of their clients were drawing an income from their pension instead of buying an annuity, and showing a client whether that money would last meant piecing together several tools. Parmenion wanted one tool for it, built on projections from its actuarial partner, Hymans Robertson.
As a Senior Designer at Monitise, I worked on the tool with a fellow designer and Parmenion’s own design team, across two prototypes and a round of adviser research. I did the visual design for both prototypes, down to every card and report, sat in every adviser session and co-wrote the research report.
- 3adviser firms, visited in their own offices
- RoleSenior Designer at Monitise
- ClientParmenion
- PlatformDesktop web, inside Parmenion’s adviser site
The problem
Advisers were building plans from tools that didn’t agree.
Before we joined, Parmenion had asked advisers what made retirement planning hard. Life expectancy came from national tables, modelling from a provider’s website and the rest from the adviser’s own spreadsheet, with the client’s details typed in again each time.
- National tablesdetails retyped
- Provider sitesdetails retyped
- Own spreadsheetdetails retyped
- Reportdetails retyped
The tools didn’t agree with each other either.
Growth and inflation assumptions changed from one to the next, and some of the figures had nothing behind them that an adviser could defend.
Couples had to be entered as two separate people, even though their plans only work as one.
Clients found the conversation hard as well.
They weren’t sure what income they needed, found it frightening that their fund could fall sharply, and struggled to picture what their retirement would look like.
The brief
One tool an adviser could use with the client.
Parmenion asked for an adviser-led tool that guides a client through the retirement conversation, lowers the risk of running out of money, runs on credible data, helps produce the suitability report the adviser has to write, and shows where the adviser adds value.
Our job was to turn their model into something an adviser would trust enough to use in front of a client.
First prototype
From one graph to the whole meeting.
Parmenion came to us with a concept: a fund model graph with a row of survival probabilities underneath, and a written summary comparing drawdown with an annuity. The model behind it was strong. It still had to work as a tool in an adviser’s day.
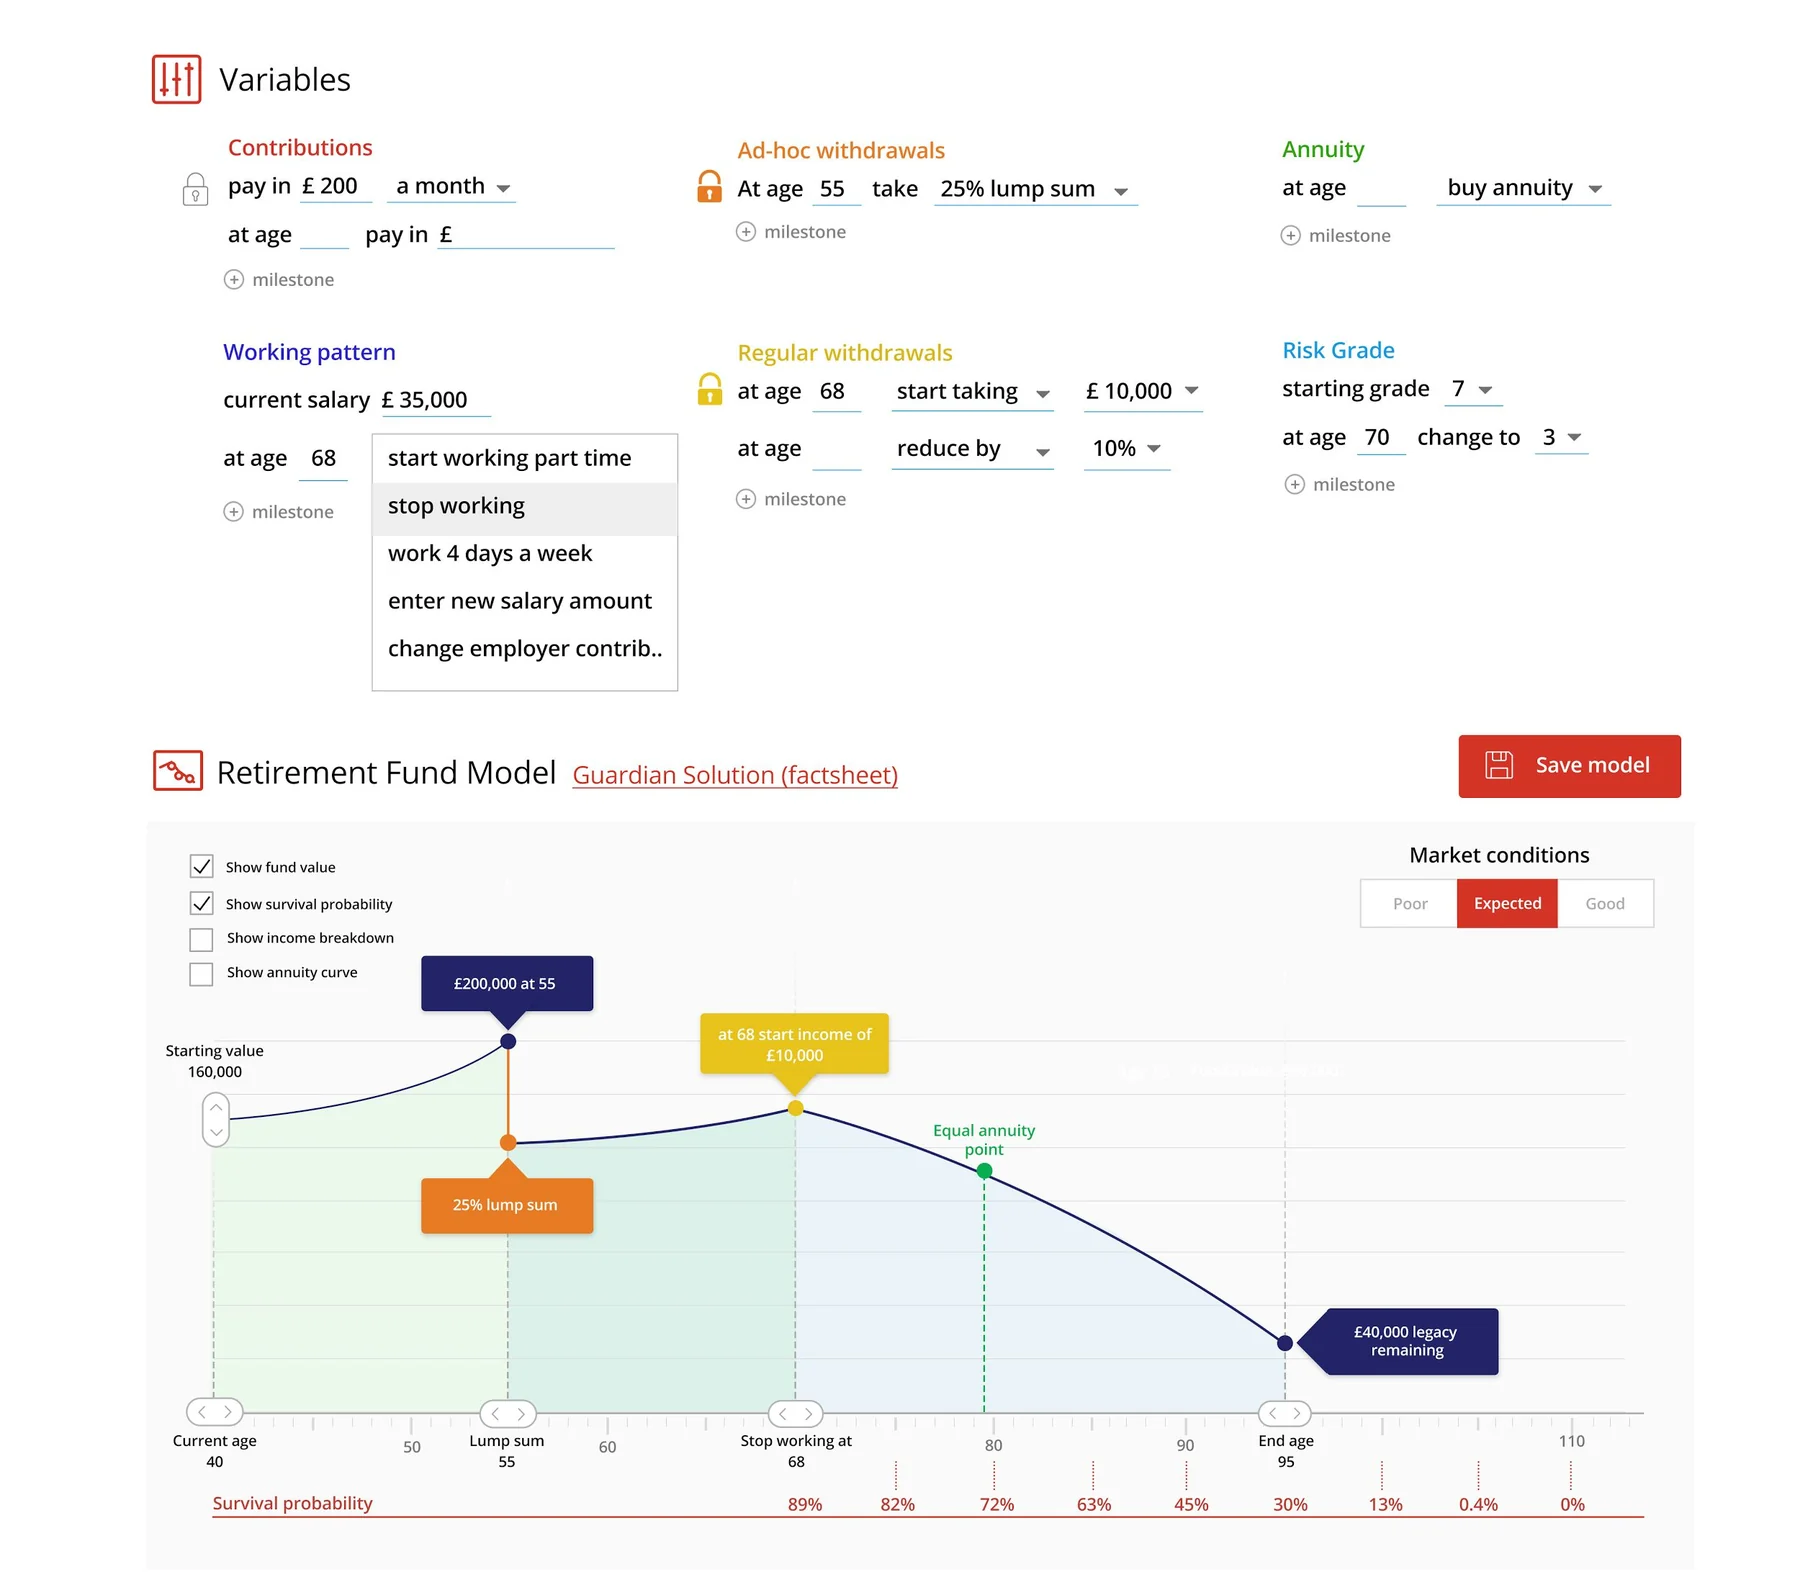
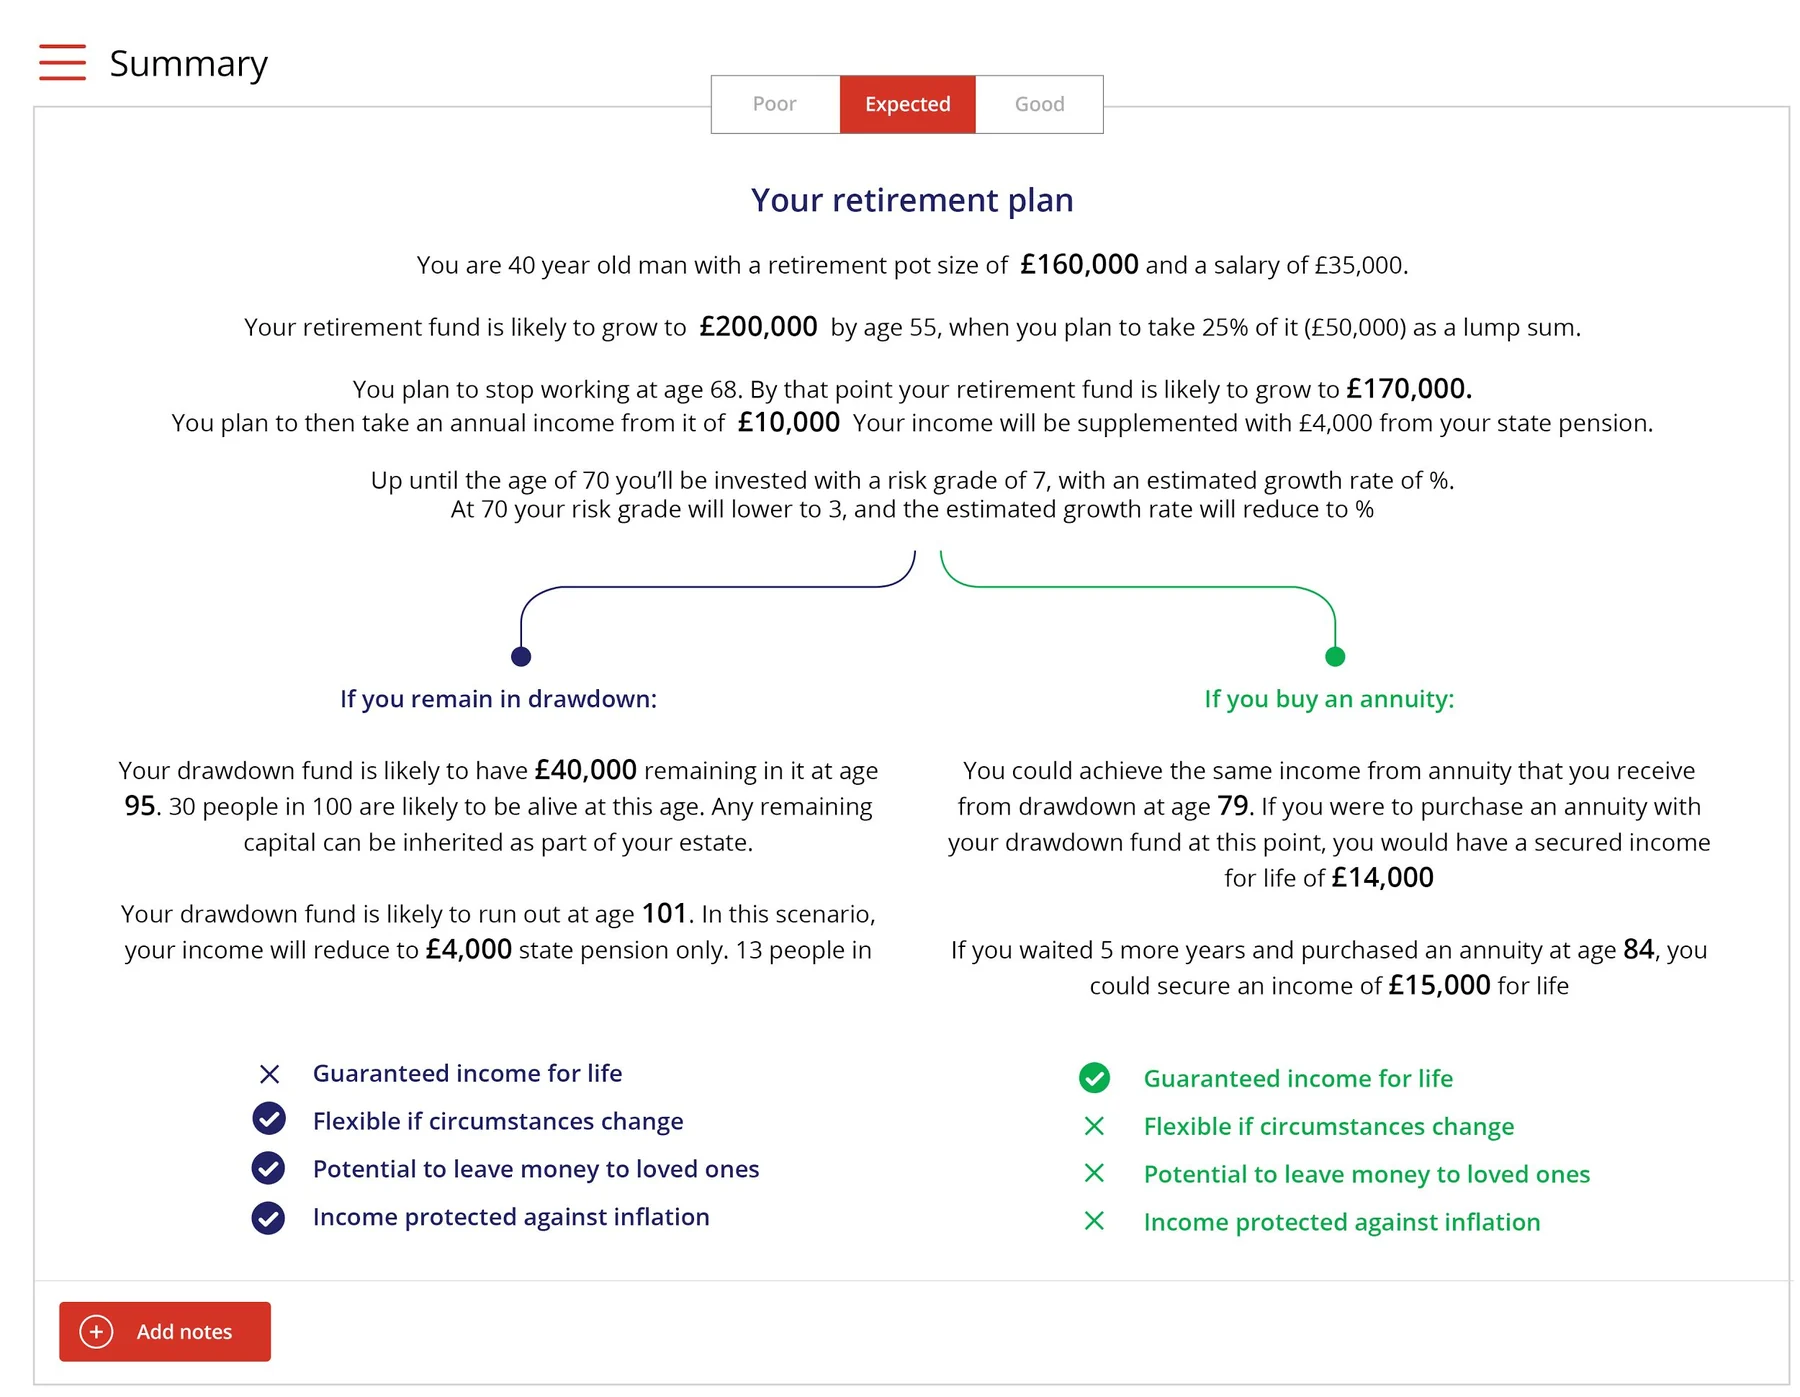
Parmenion’s concept, before Monitise joined.
Working with Parmenion’s own design team, we mapped the whole client meeting around it.
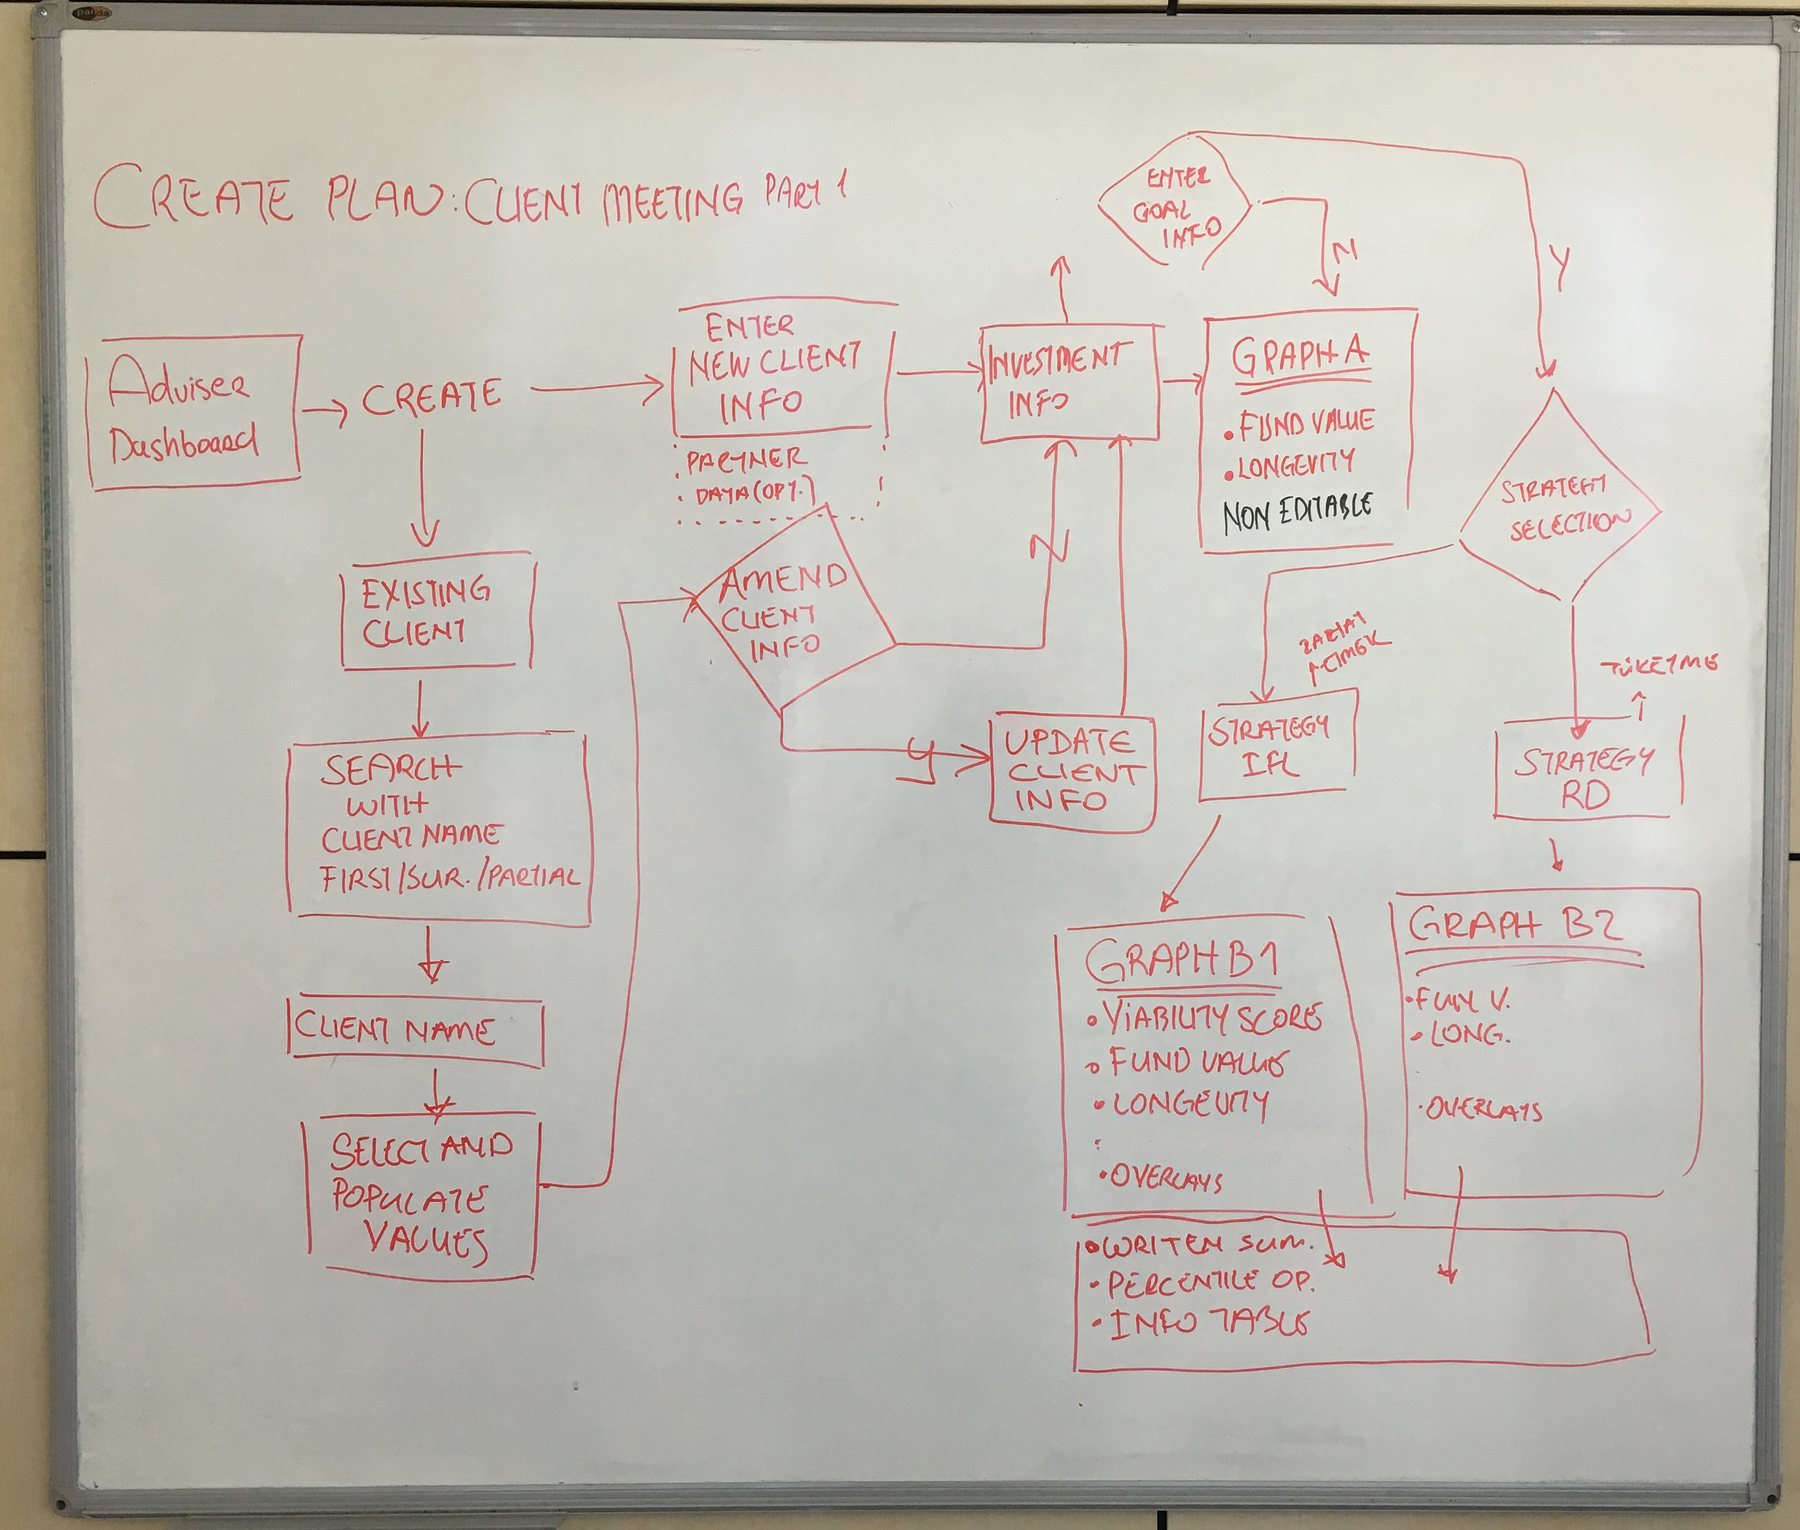
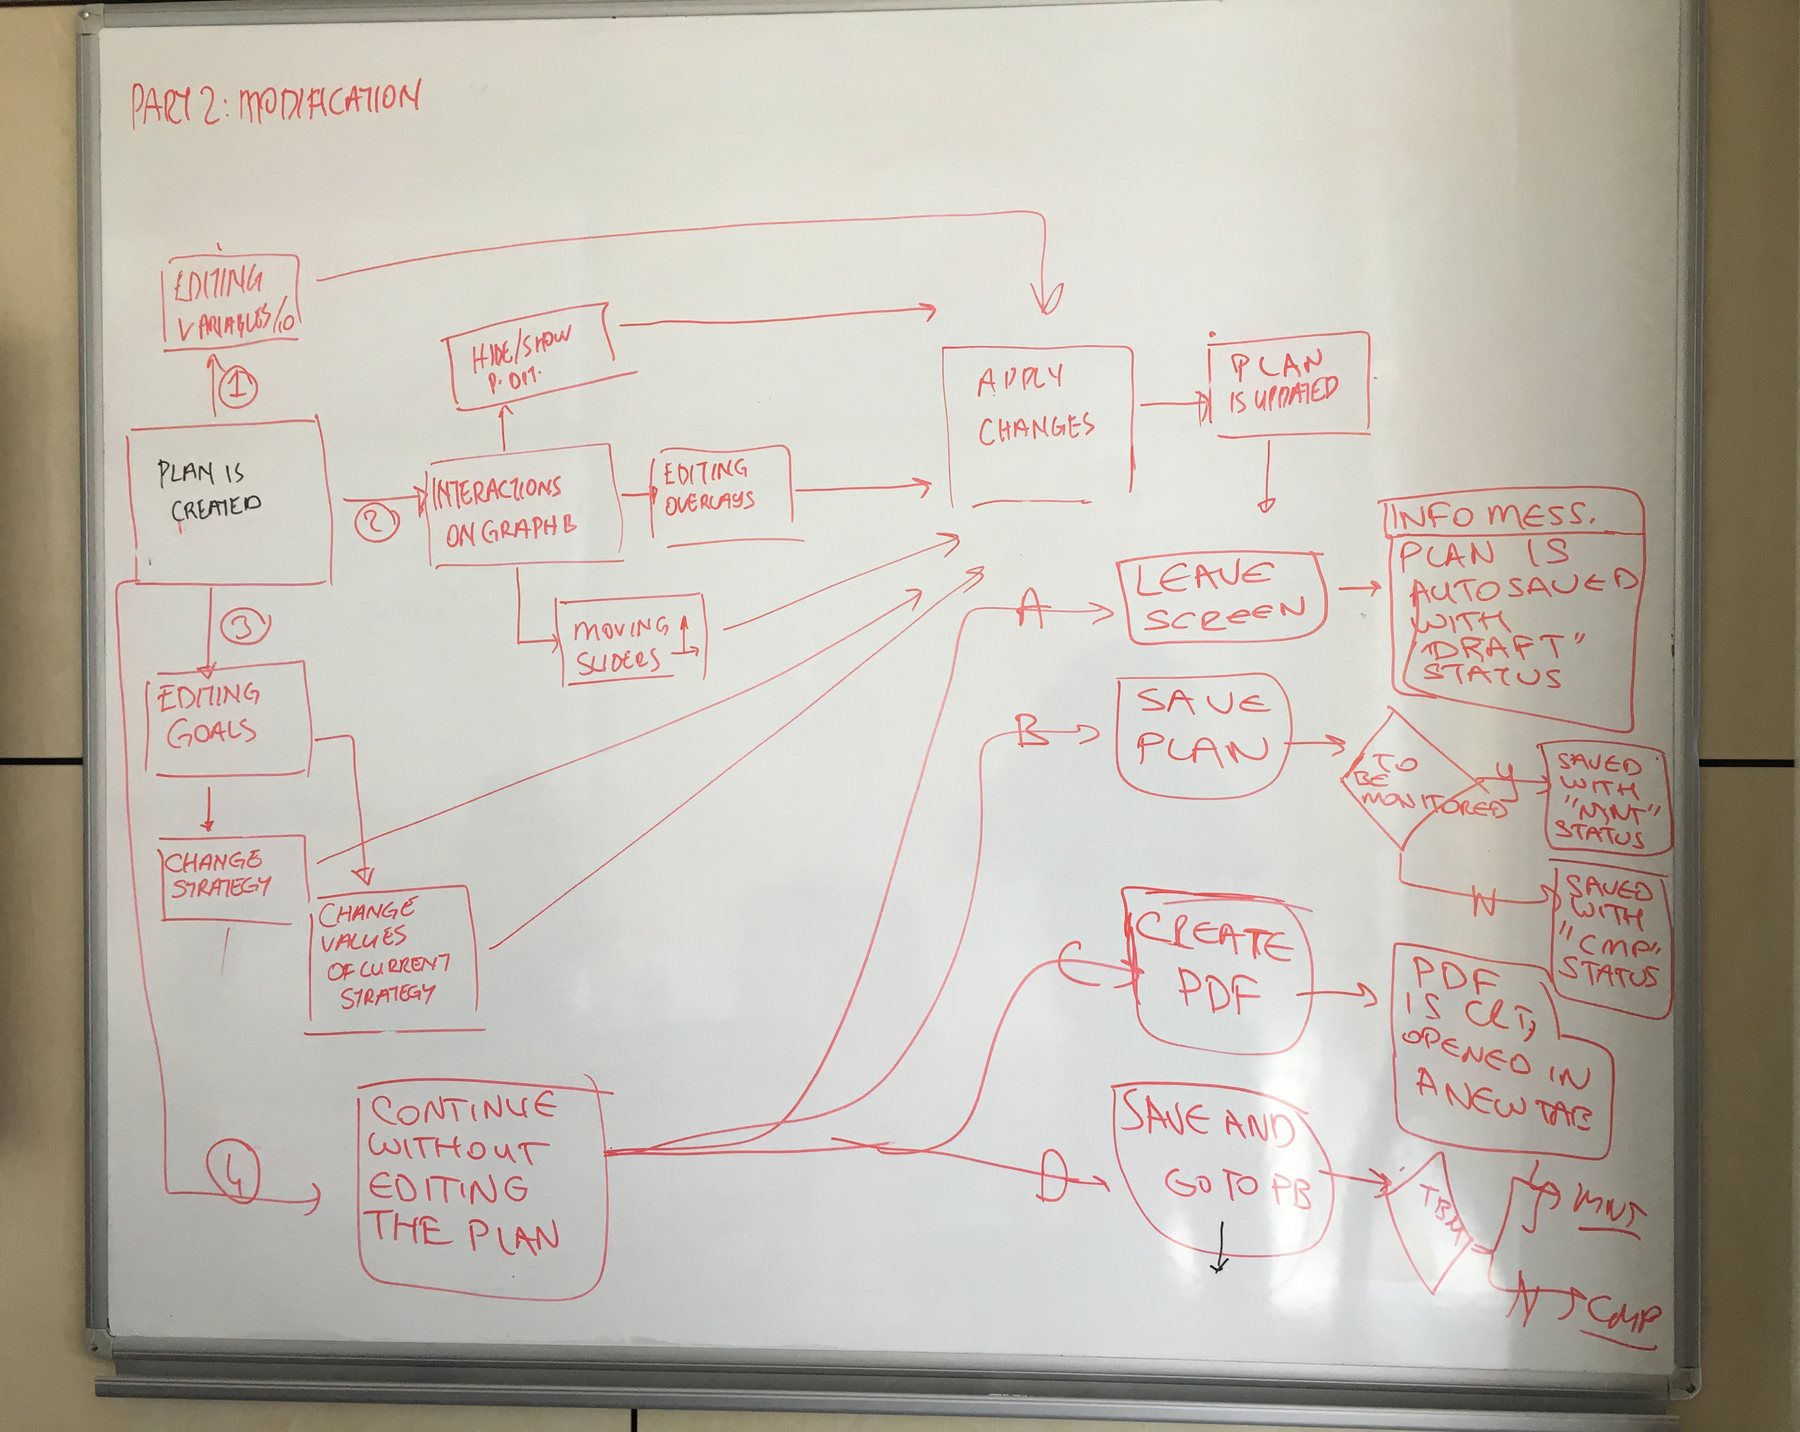
Mapping the client meeting.
Everything sat in one place, inside the adviser site they already used: the client’s details entered once, the model behind them, and the report at the end.
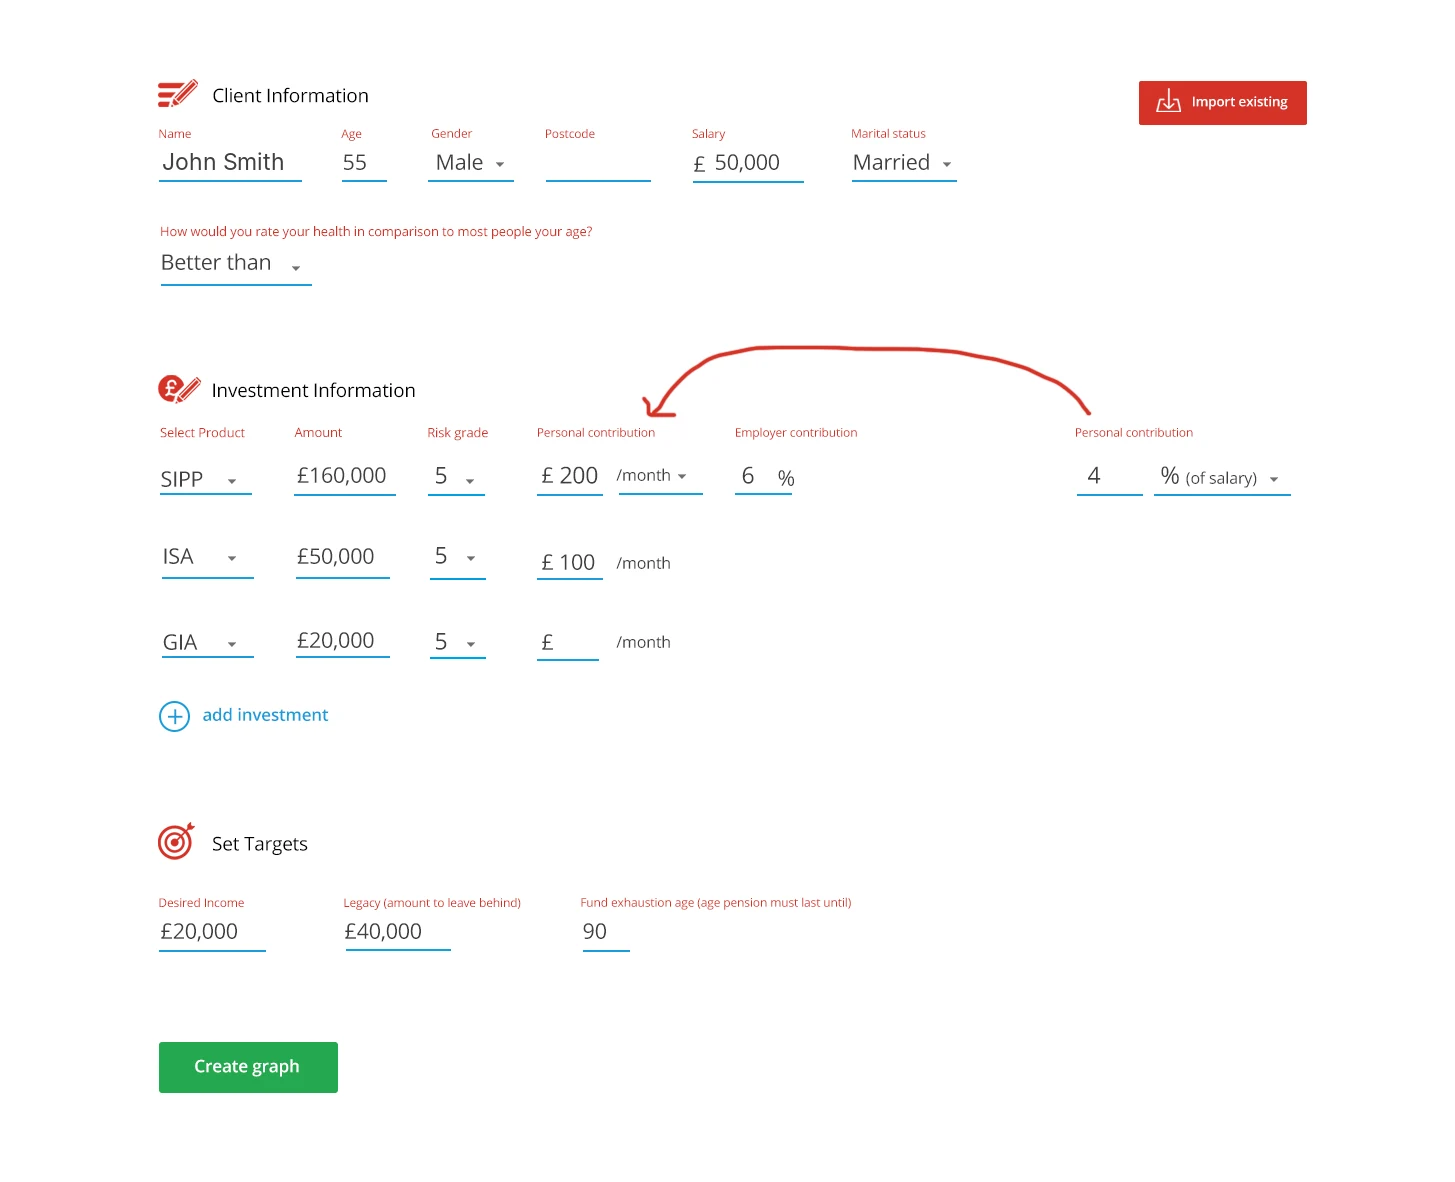
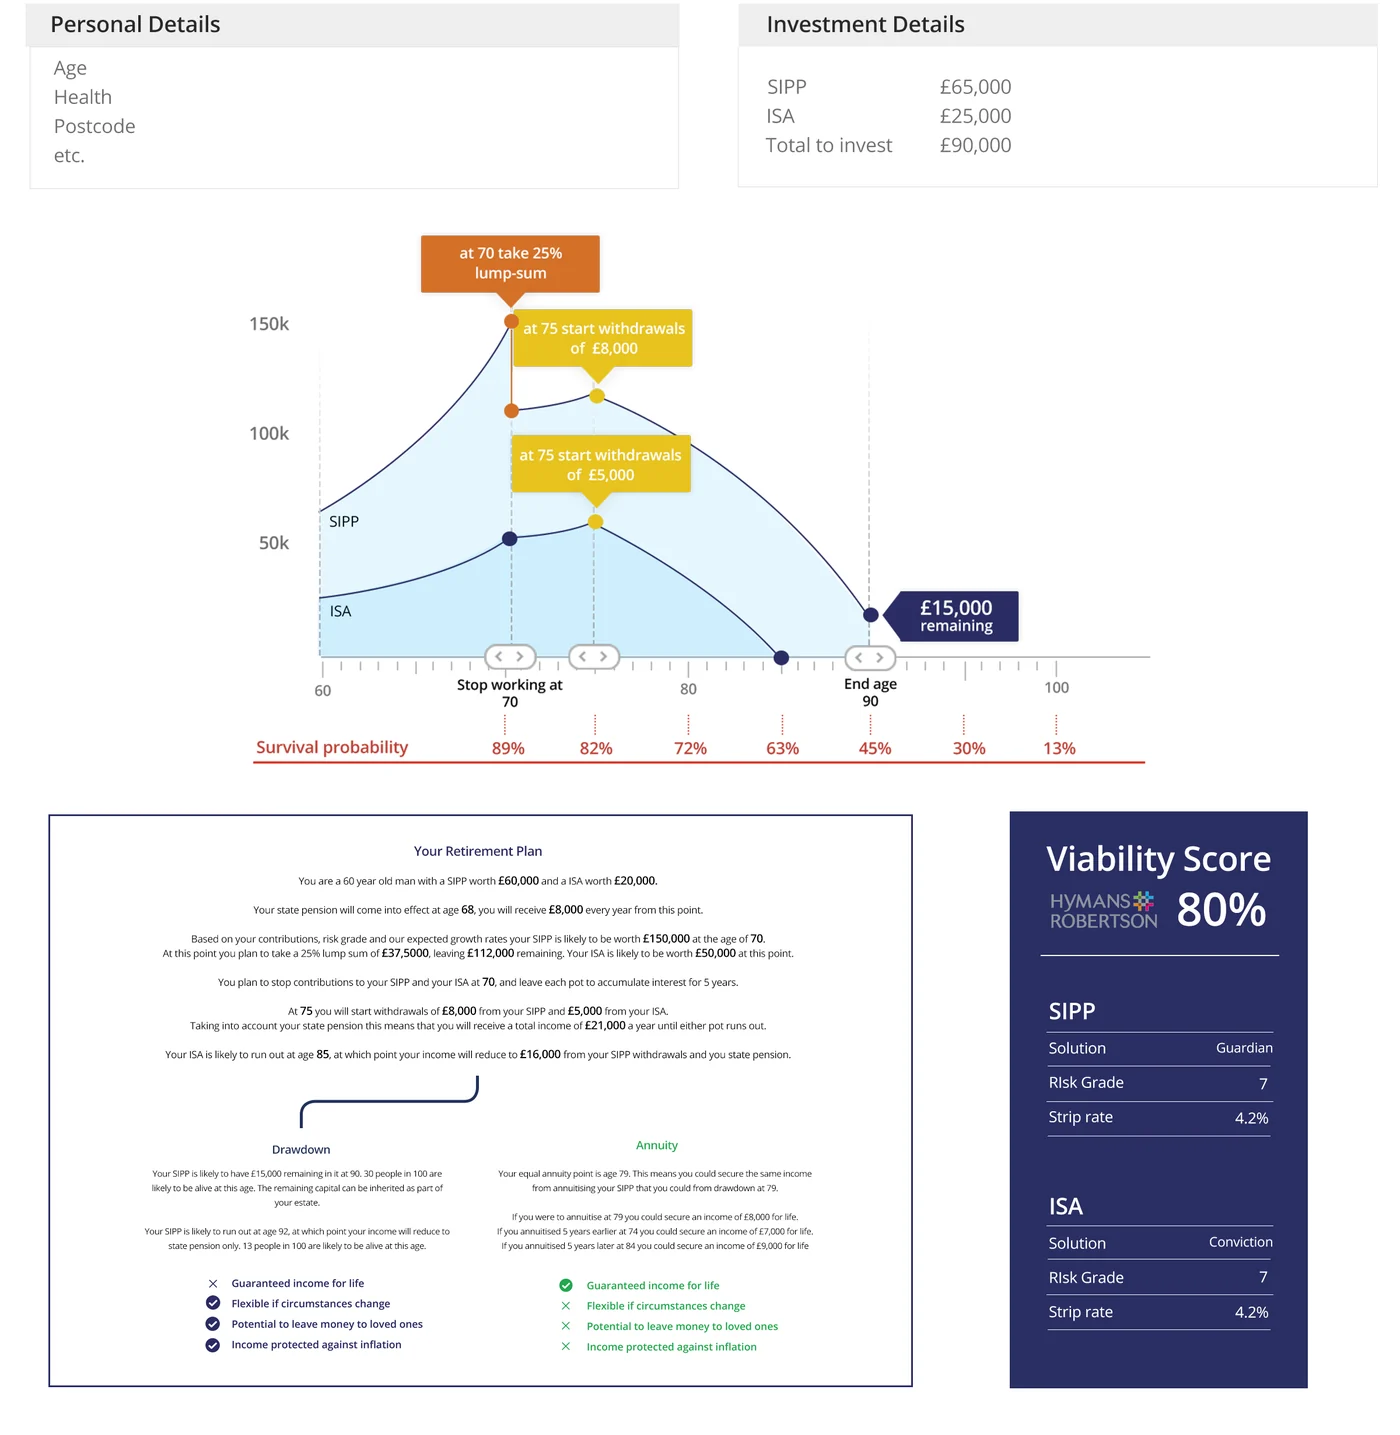
We started with one client and one question. A 60-year-old with a pension and an ISA wants £20,000 a year and something to leave behind. Can he have both?
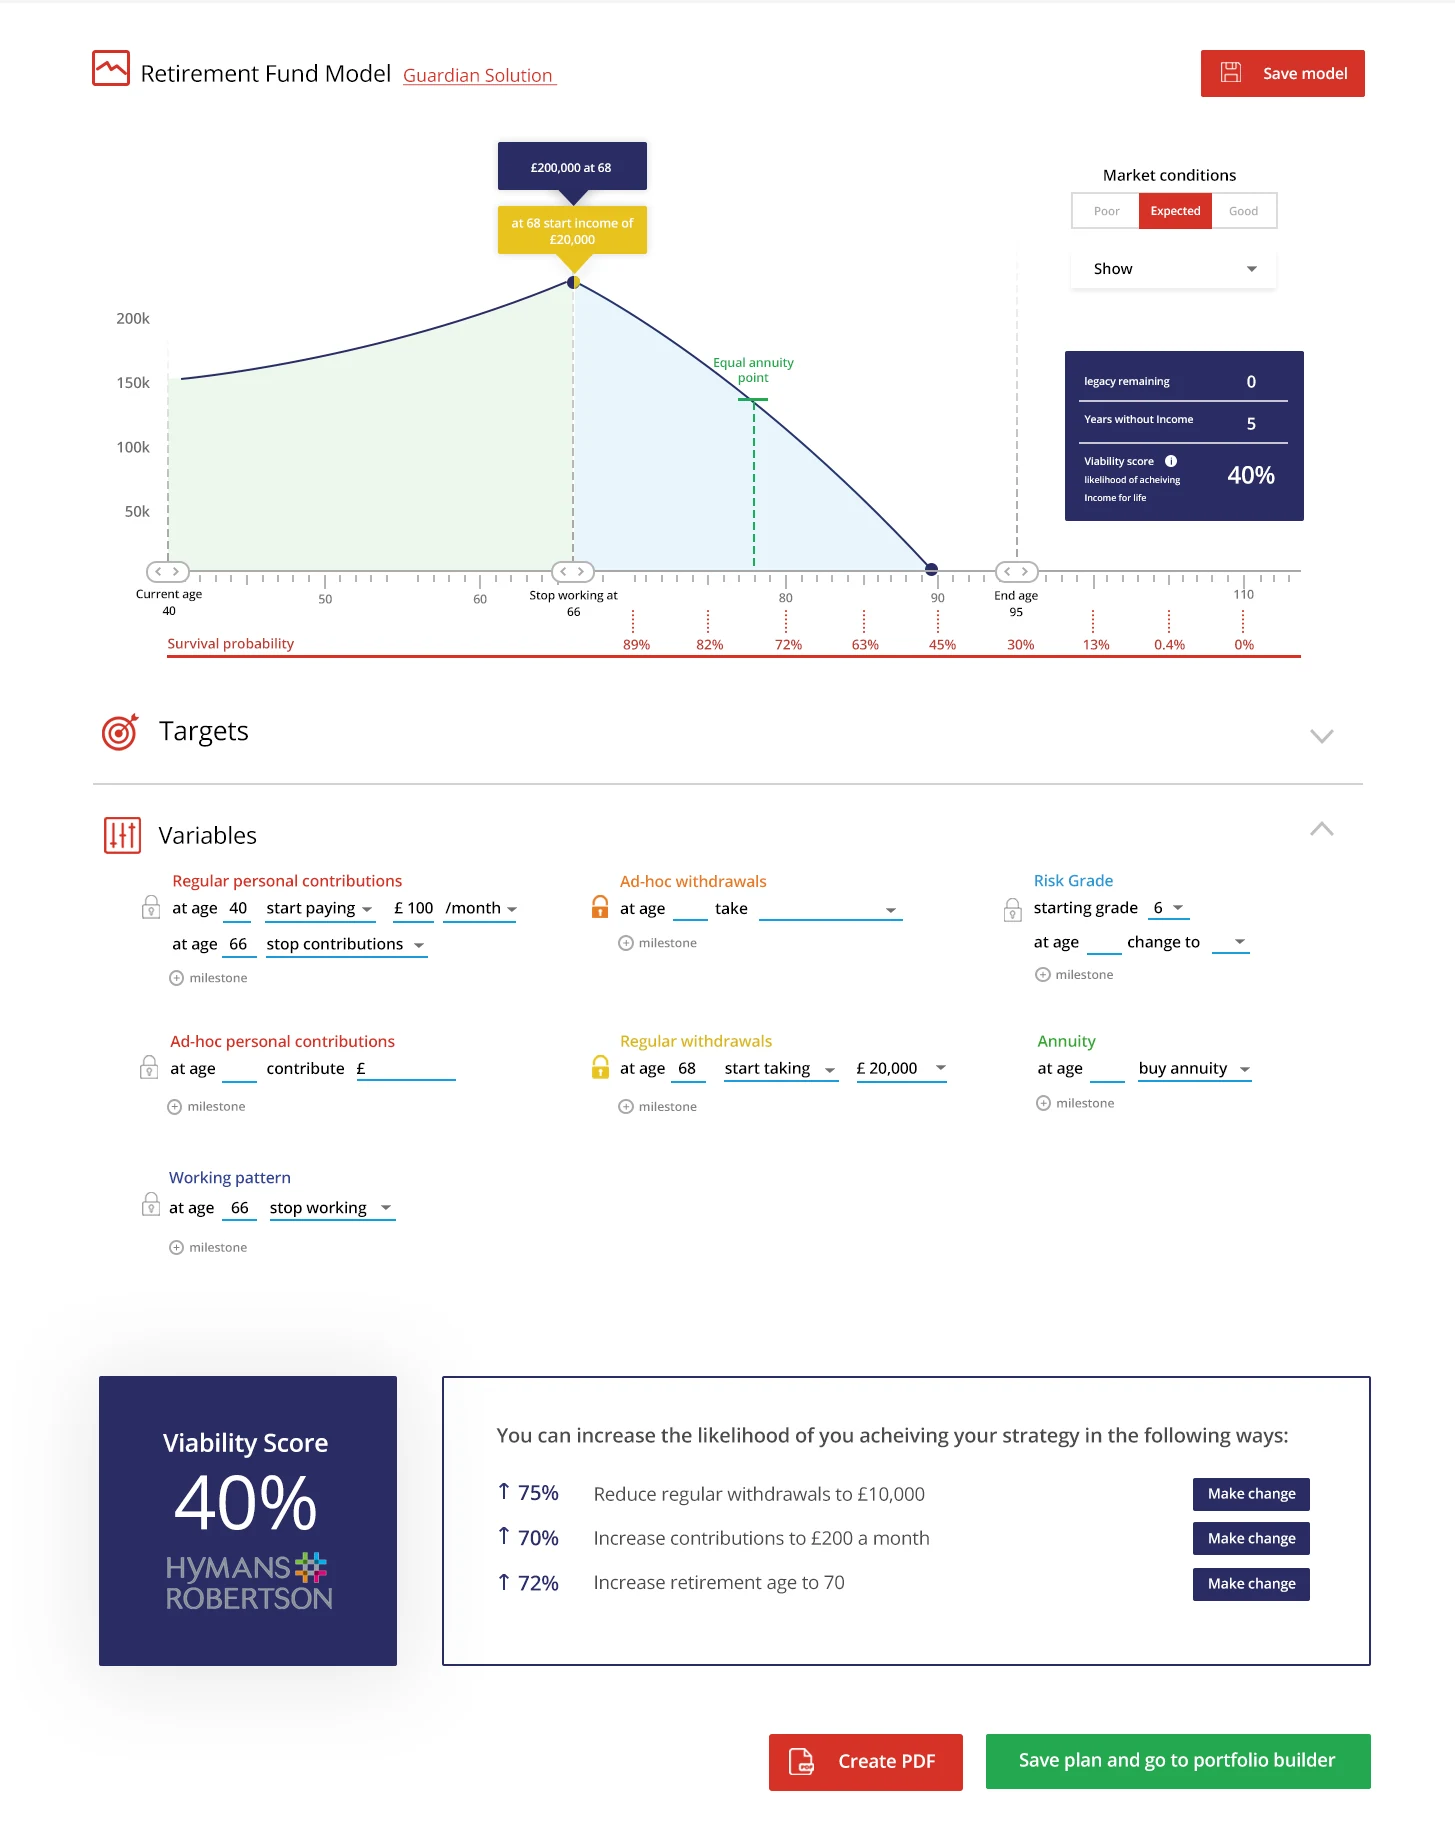
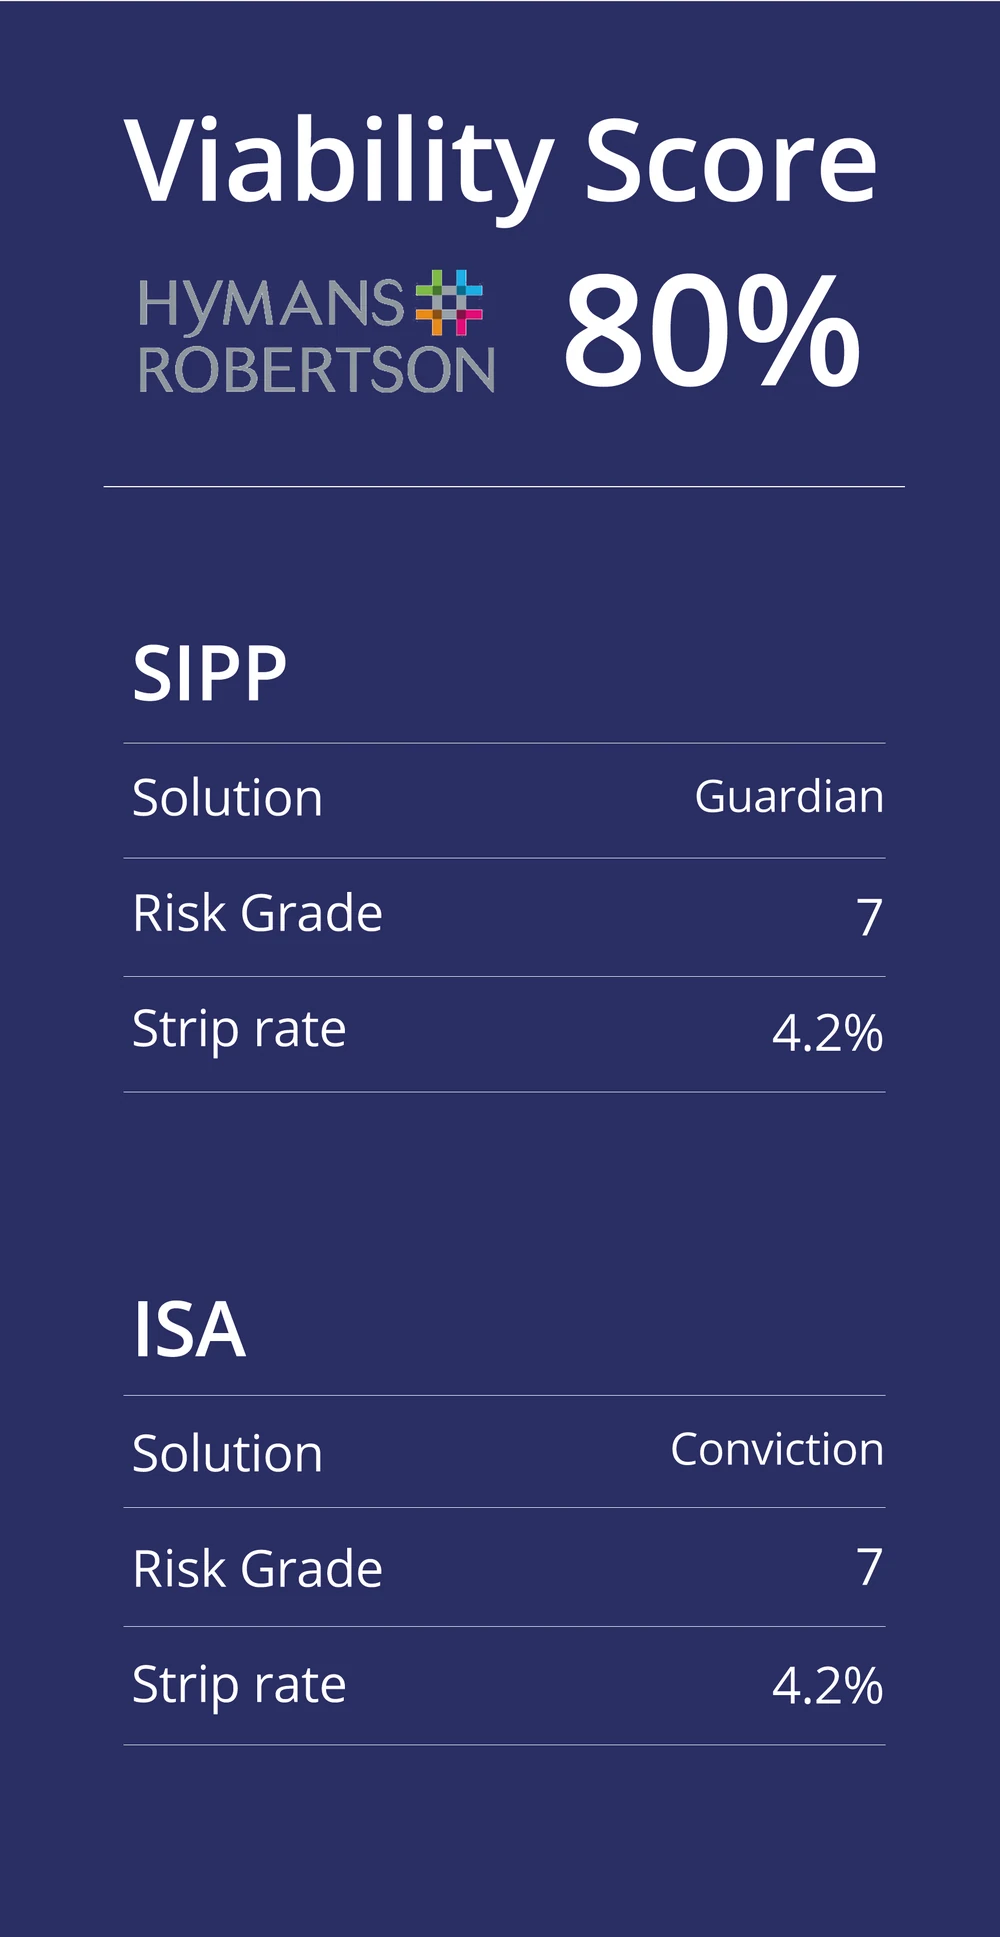
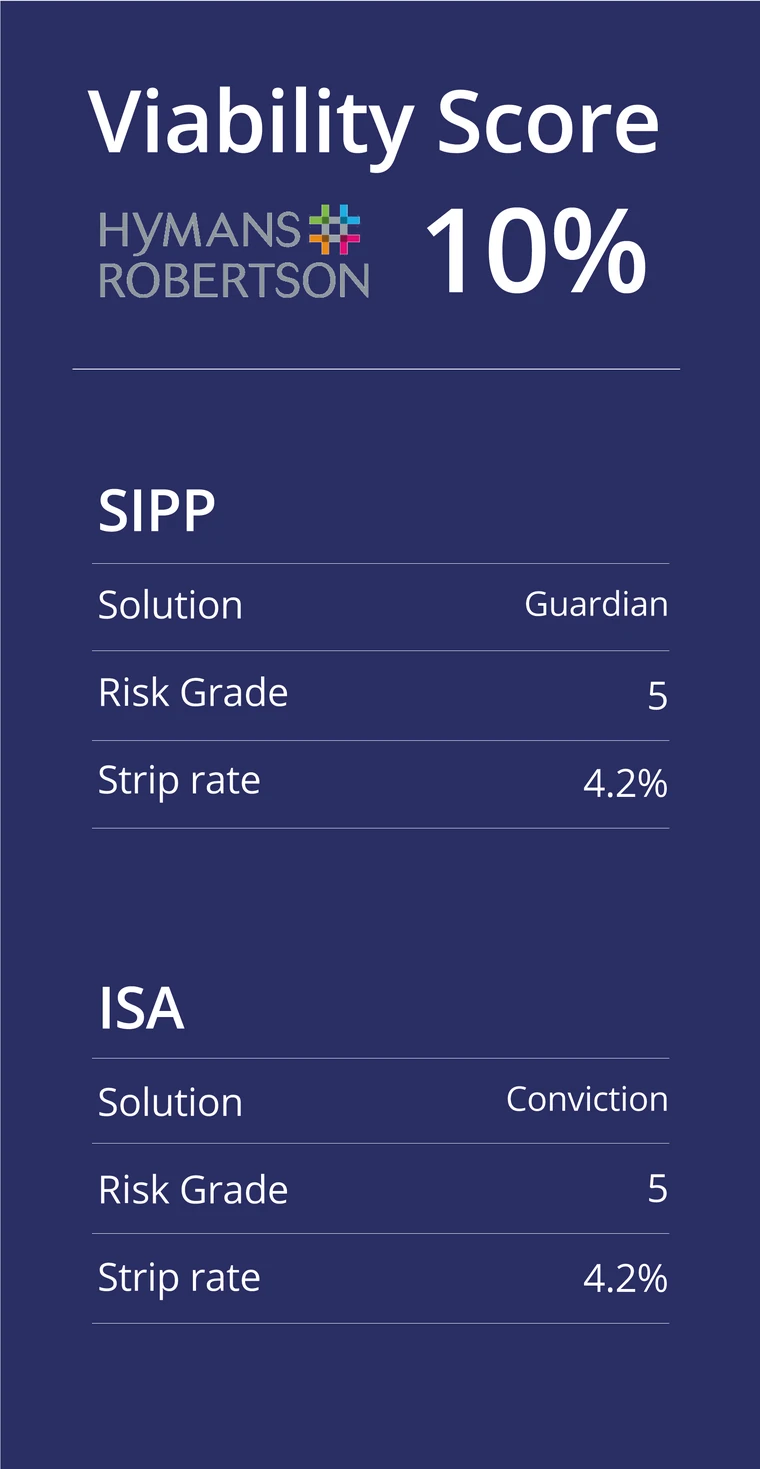
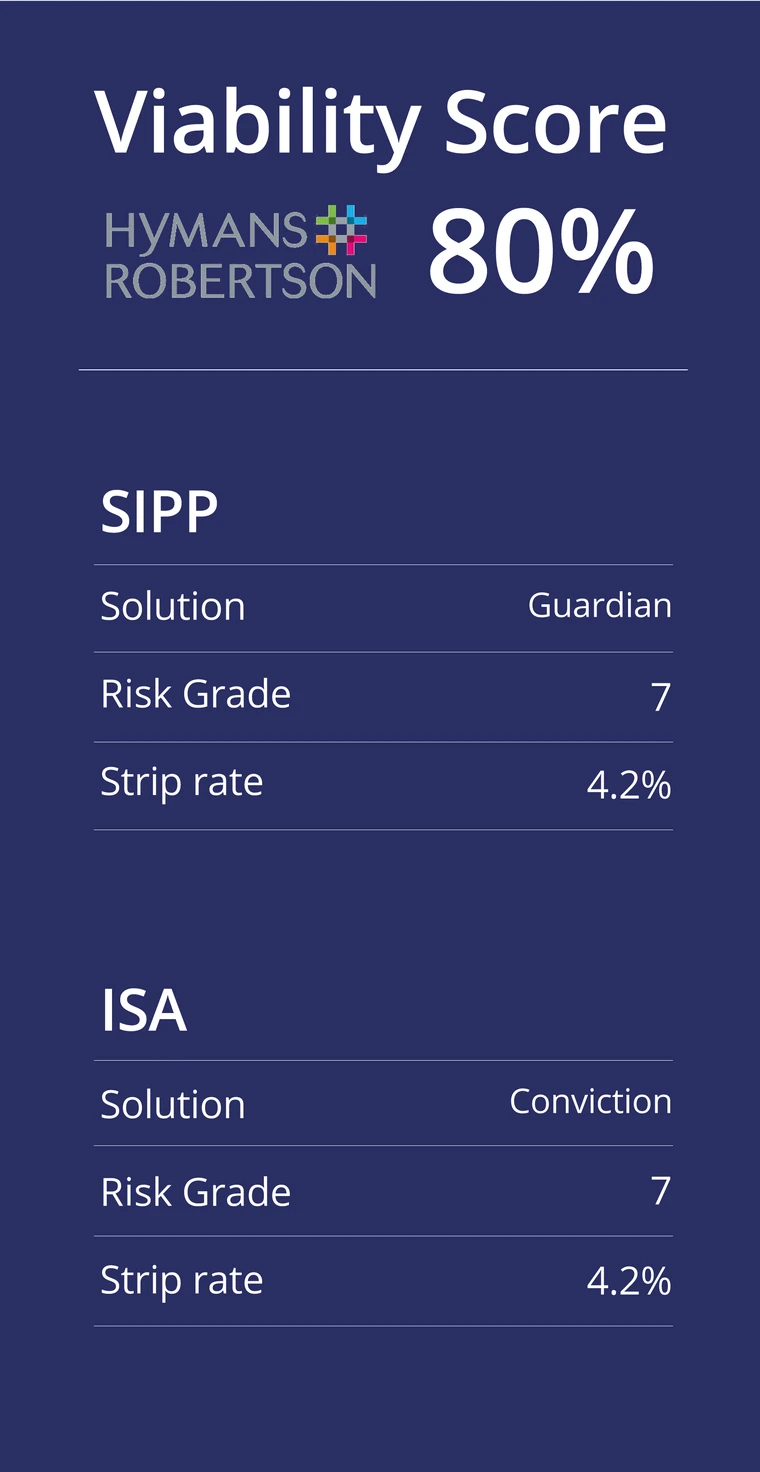
The answer is one number, the viability score from Hymans Robertson’s modelling: how likely the plan is to meet his goals. Together with Parmenion’s design team, we put it on a card beside the graph, with the strategy behind it, and it changes as the plan changes. In this scenario it went from 10% to 80%.
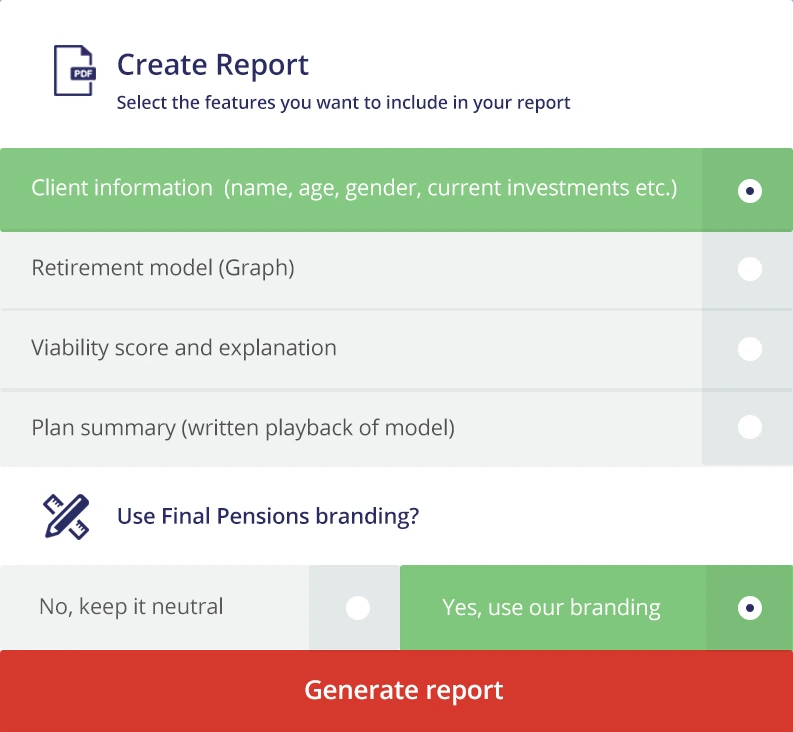
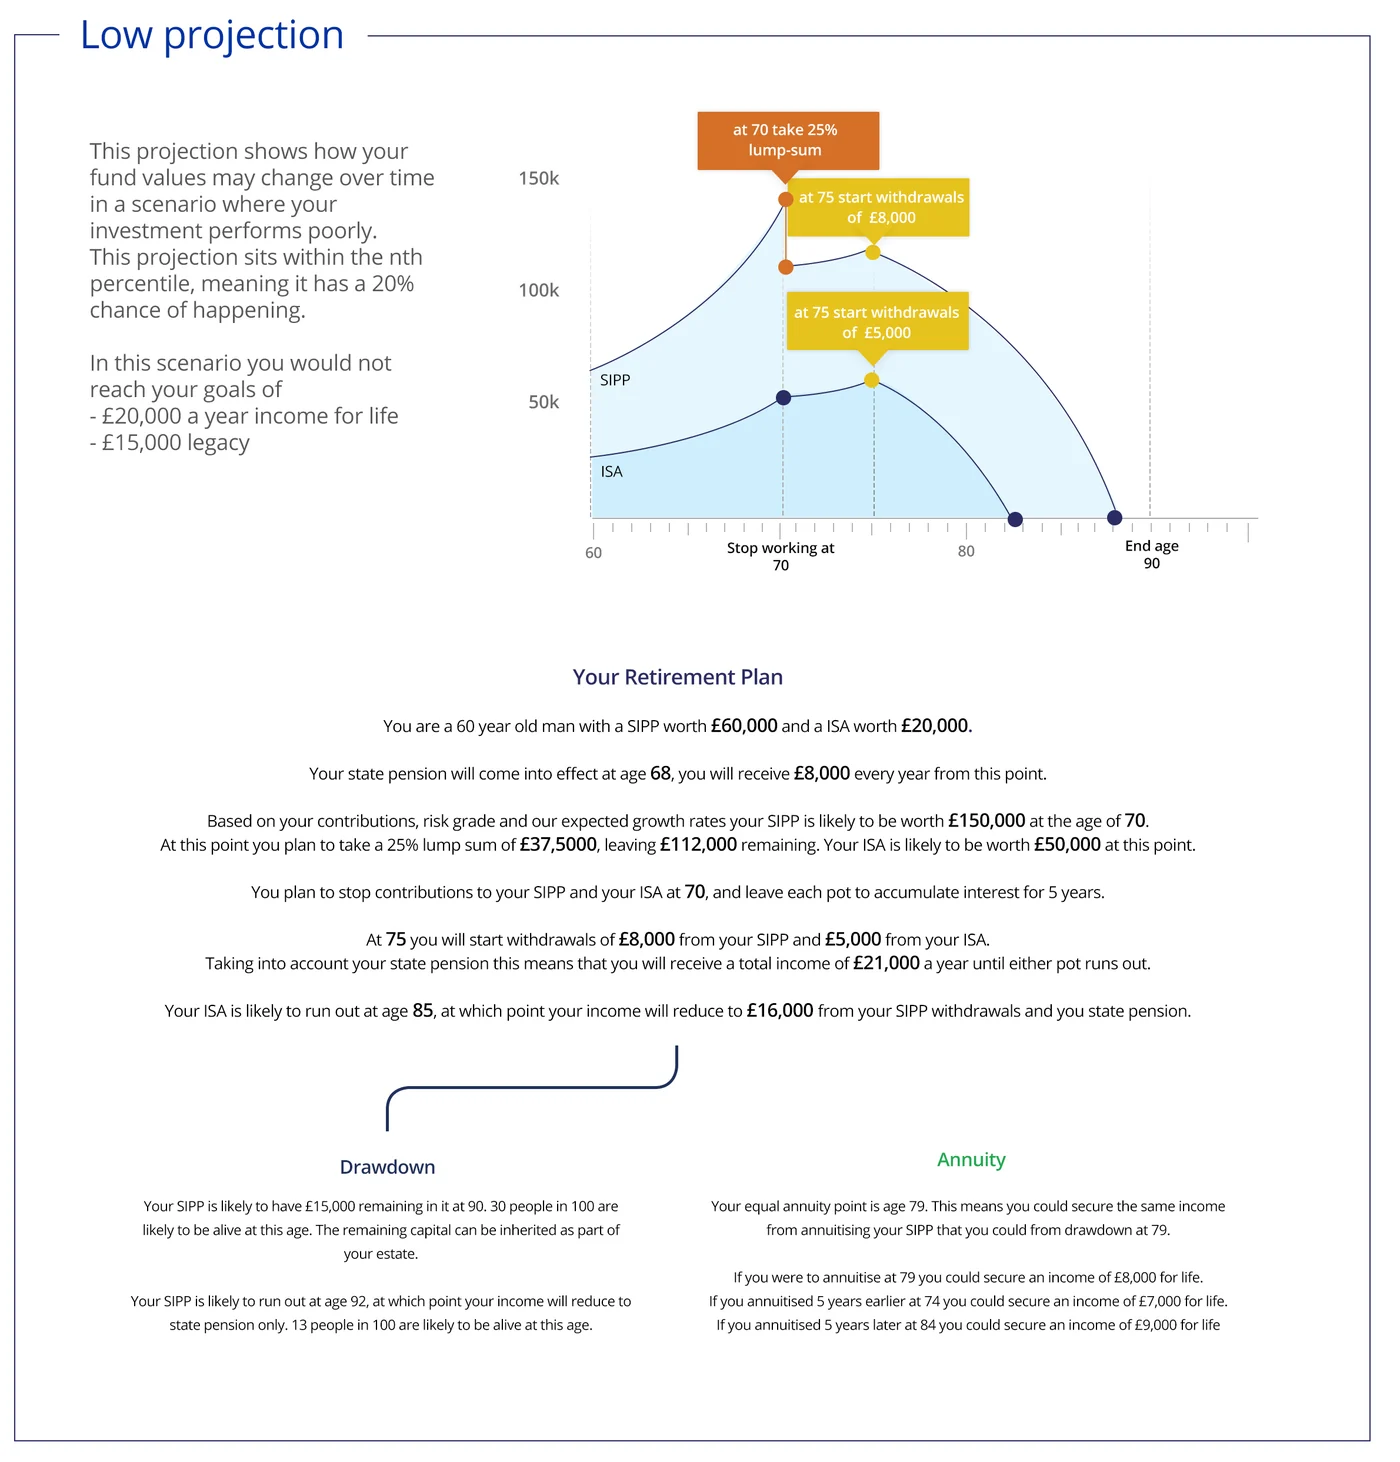
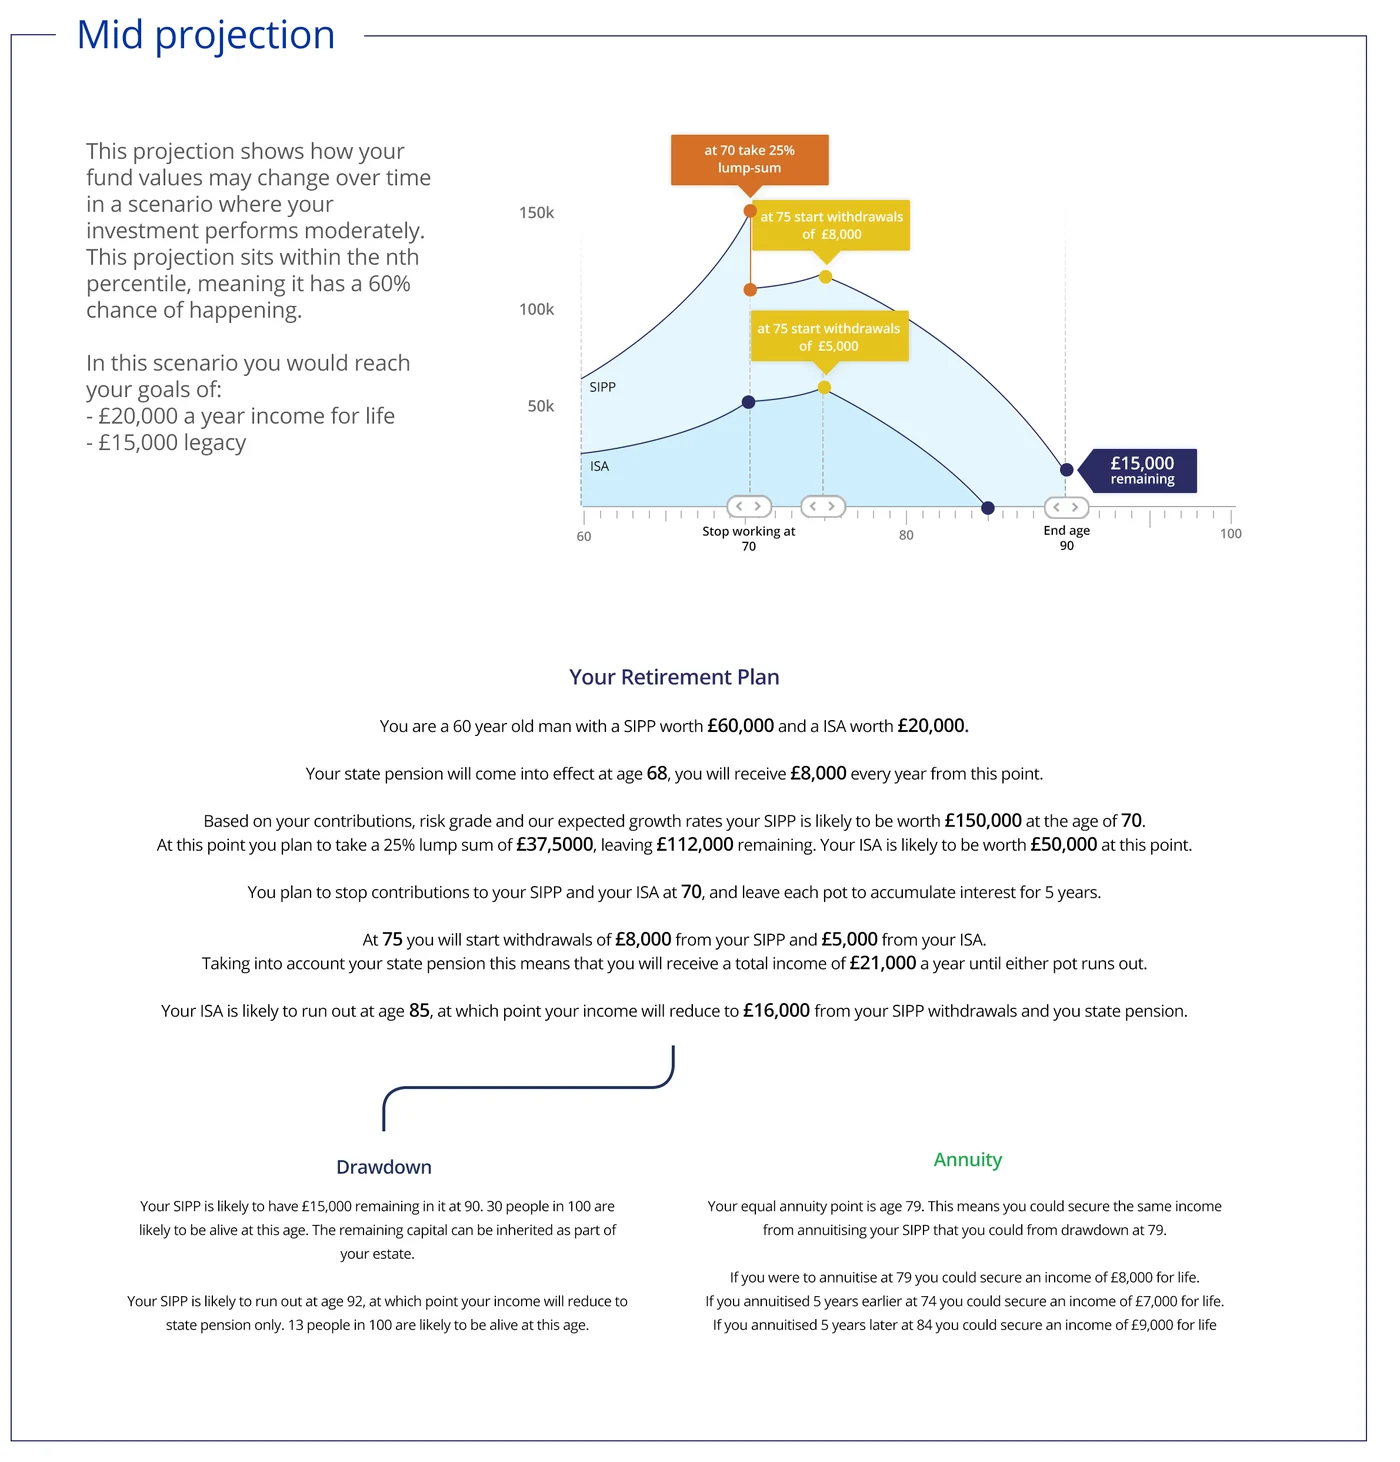
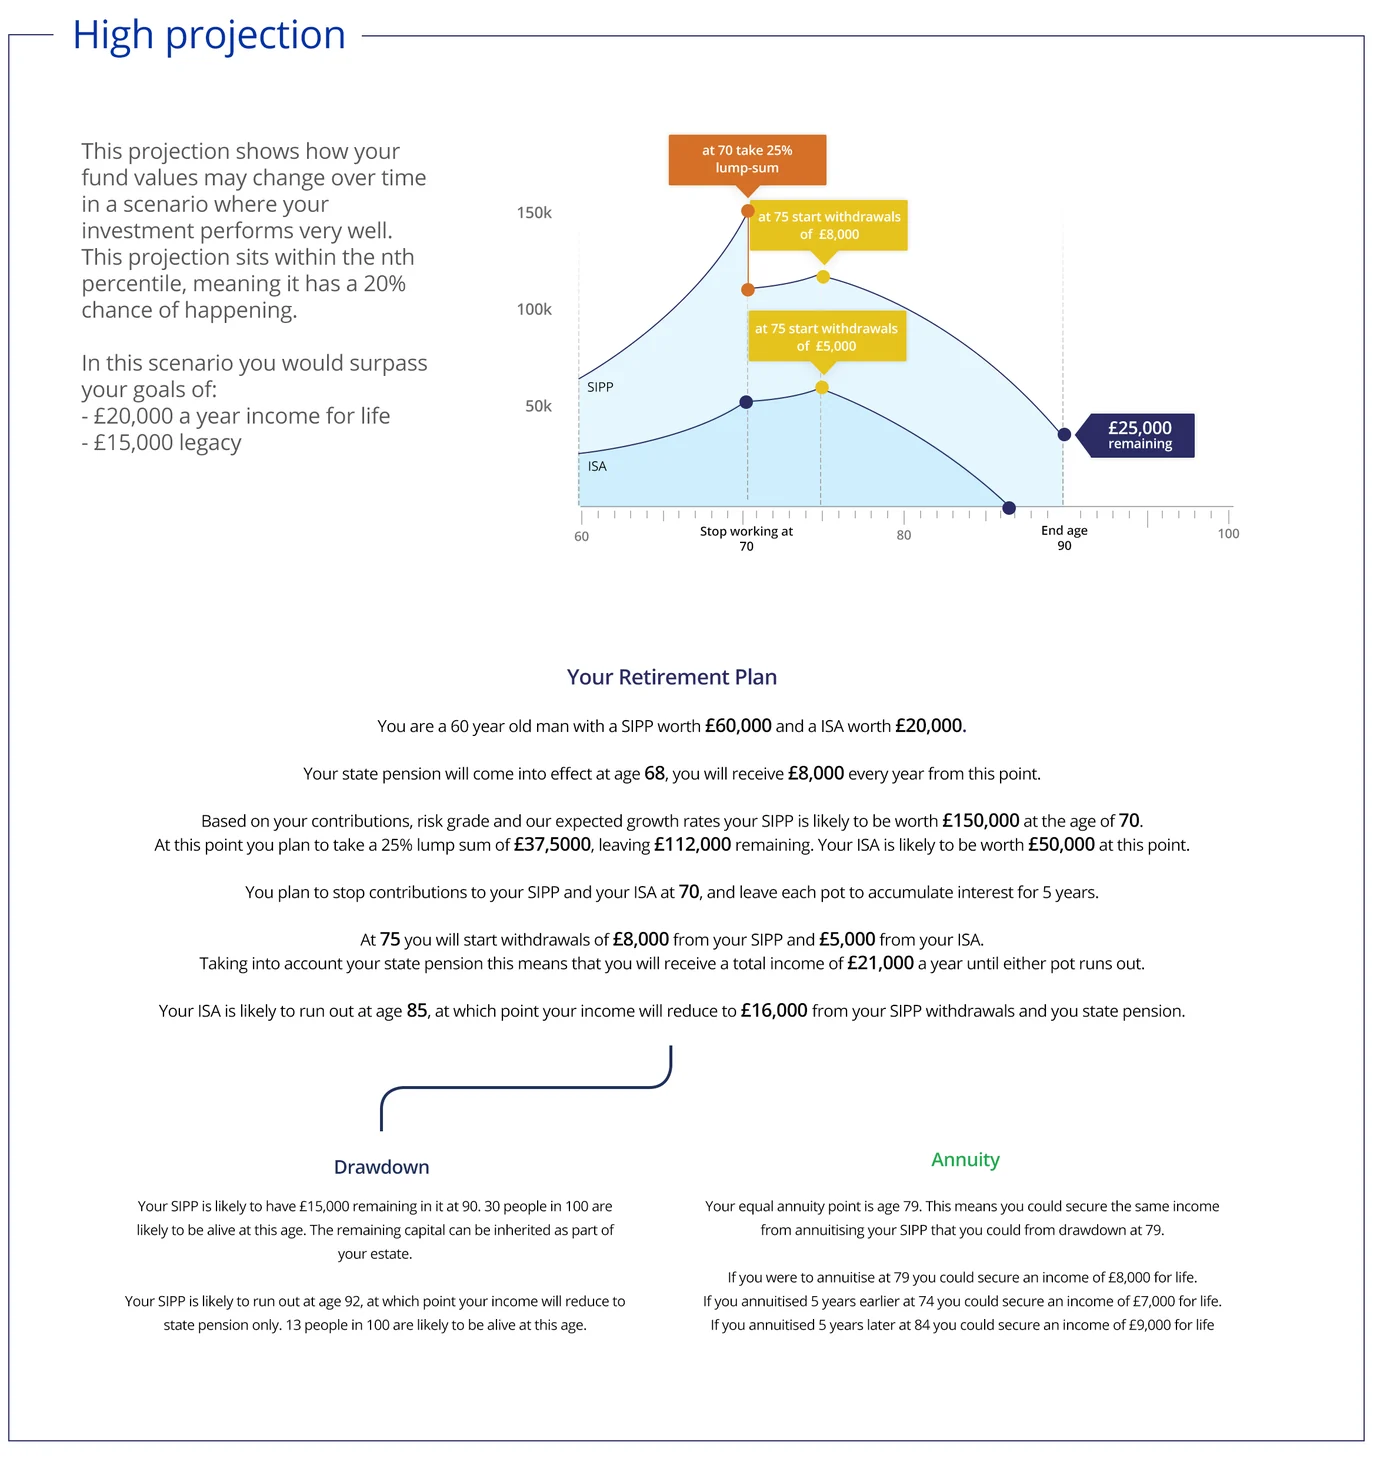
The meeting ended with a report. The adviser could choose what goes in and whether it carries the firm’s brand or stays neutral, with low, mid and high projections and a letter in plain words.
The research
We tested it in advisers’ own offices.
With Parmenion’s product team, we visited three adviser firms and sat with four people, three advisers and a paraplanner, each in their own office.
We asked how they plan retirement today, then handed over a client scenario and asked them to think out loud while they built the plan in the prototype.
What we heard
Advisers needed to see how it worked.
Credible data had been the point of the brief, and it wasn’t enough on its own.
Advisers kept coming back to what they couldn’t see: where the survival figures came from, what the market scenarios meant, and how long each was meant to last.
“We need to know how it works behind the scenes.”
Advisers disagreed about the score. One wouldn’t show it to a client at all. Another liked it but read it the other way round: a 10% chance of success is a 90% chance of failure, and a low first score brings the client back to reality.
- Black box
- Tax and inflation
- Couples
- Edit on the graph
- Simple wins
They wanted to change the plan where they were looking.
Moving up and down the page to edit a figure and then check the graph was, in one adviser’s words, “really annoying”.
Real clients are rarely one person with one pot.
Most are couples, and their income comes from more than investments: a state pension, a final salary scheme, rent.
Shaping it
Four changes for the second prototype.
In a workshop with Parmenion, we turned the findings into decisions for the second prototype.
Decision 01
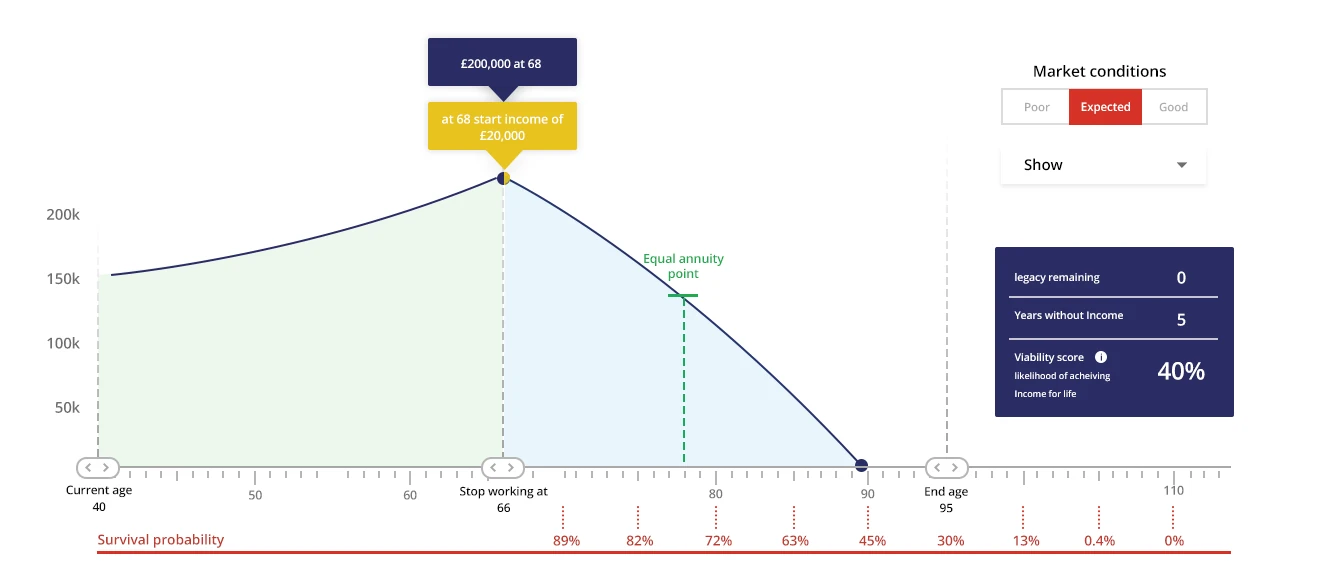
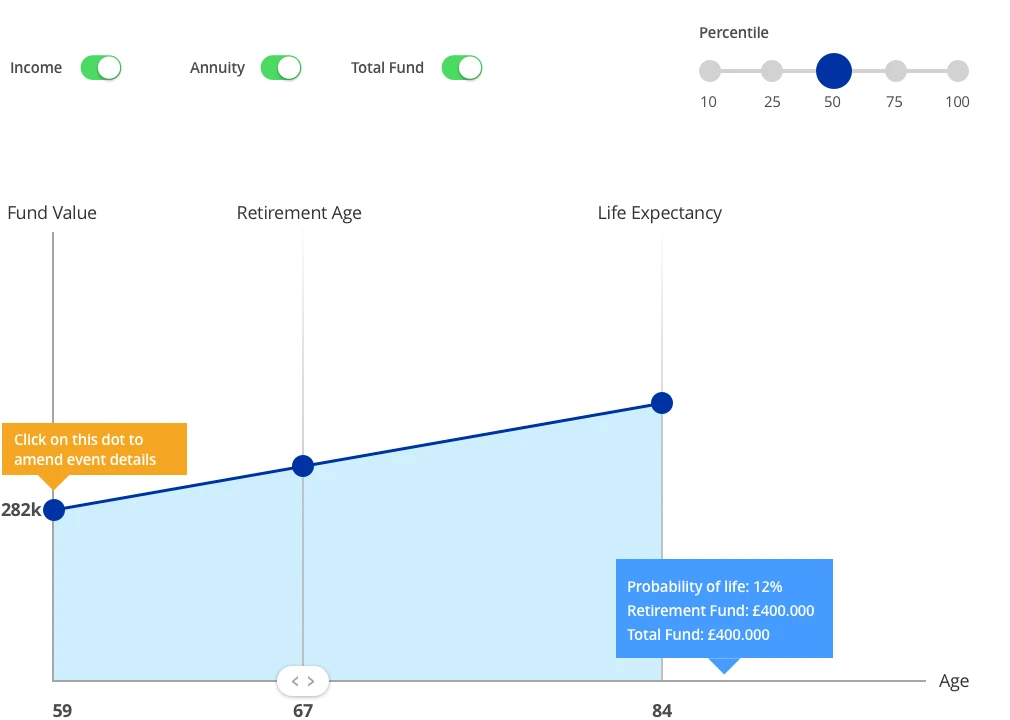
Percentiles instead of Good and Poor.
Advisers couldn’t say what Good or Poor market conditions meant, or for how long. The second prototype replaced Poor, Expected and Good with a percentile stepper.
Decision 02
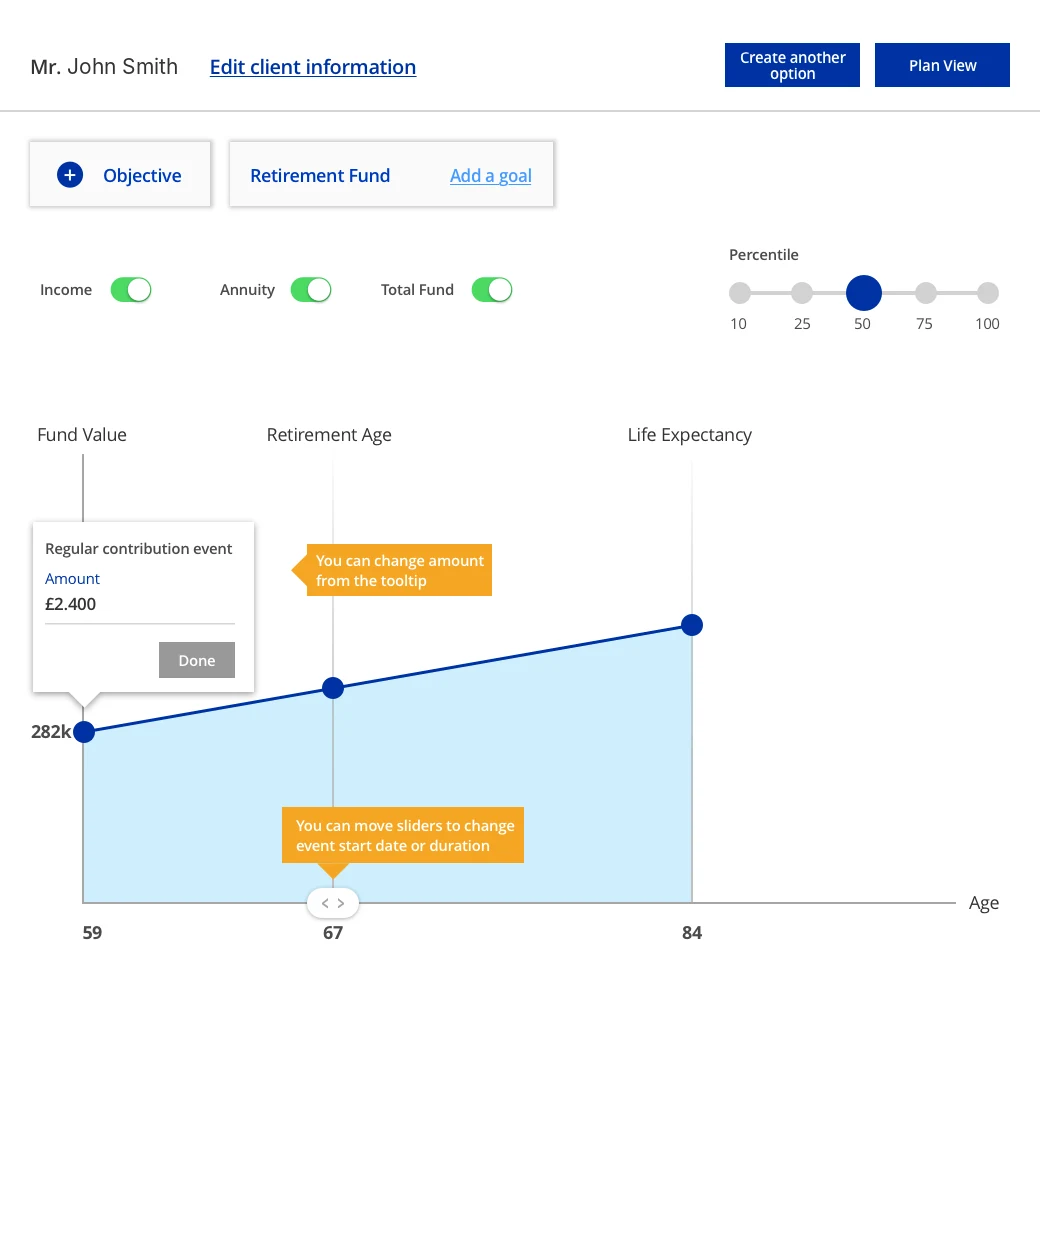
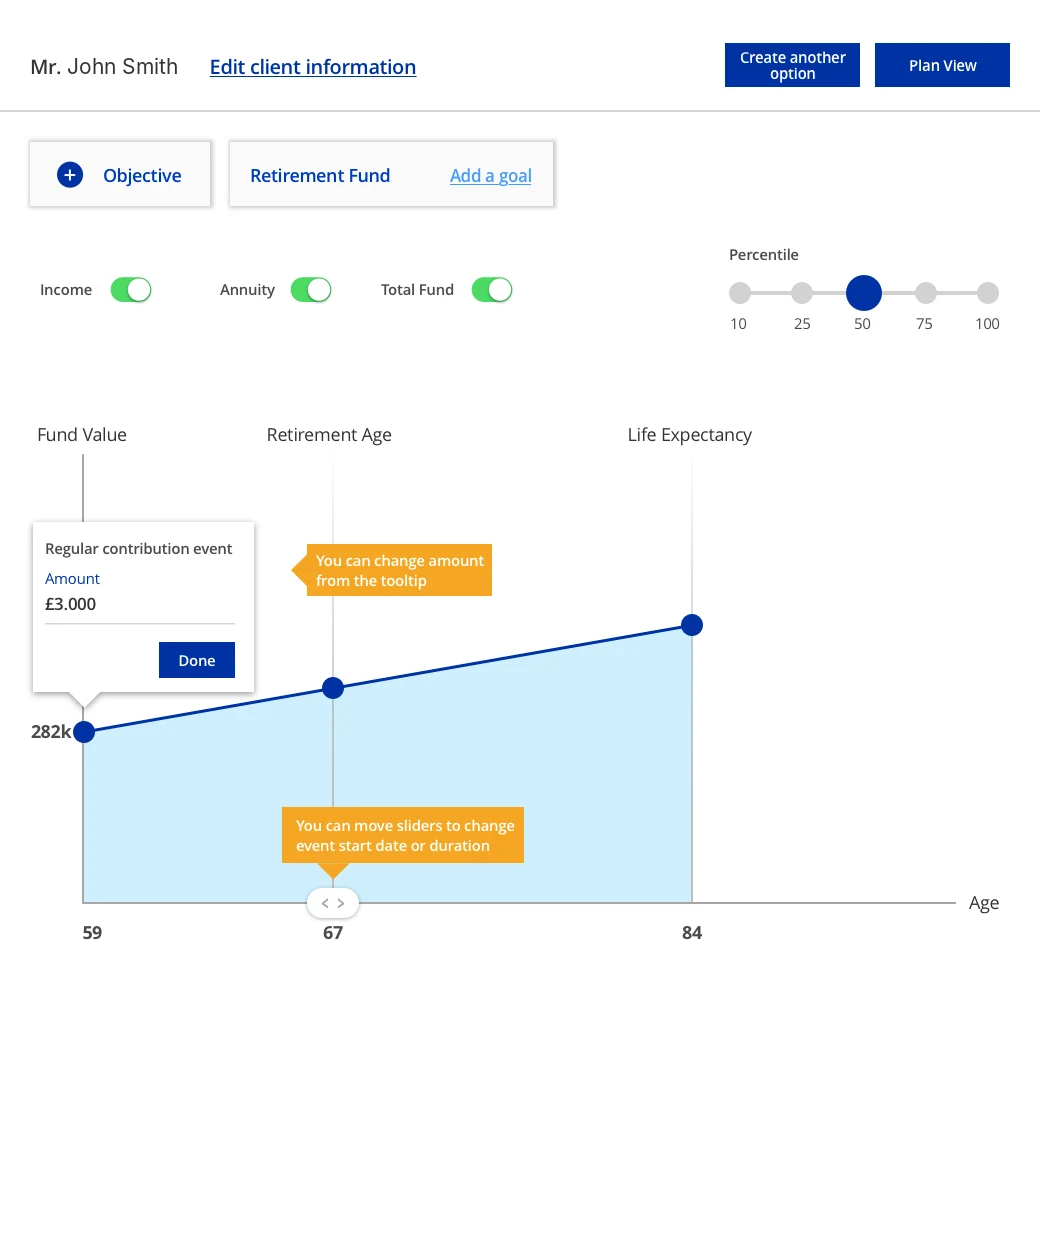
Edit on the graph.
Advisers wanted to change the plan on the graph itself. In the second prototype you click a point on the line to change an event, like a regular contribution, and move a slider to change when it starts or how long it lasts. Small notes show the way the first time.
Decision 03
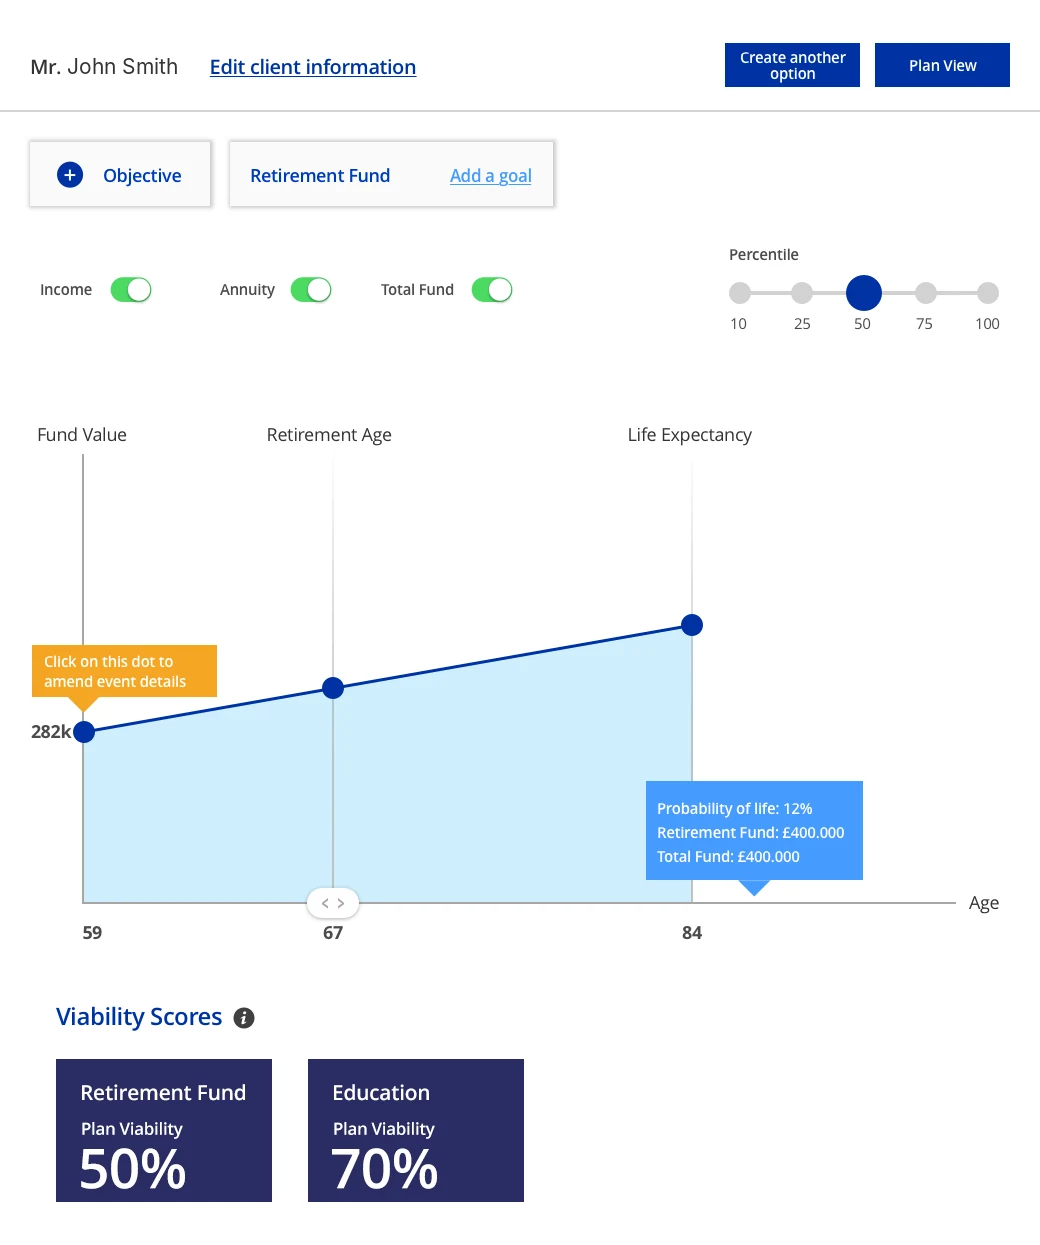
One score per goal.
In the research, advisers planned around goals and milestones, not a single target. In the second prototype a plan can hold more than one objective, like a retirement fund and an education fund, and each gets its own viability score.
Decision 04
Couples and other income in one form.
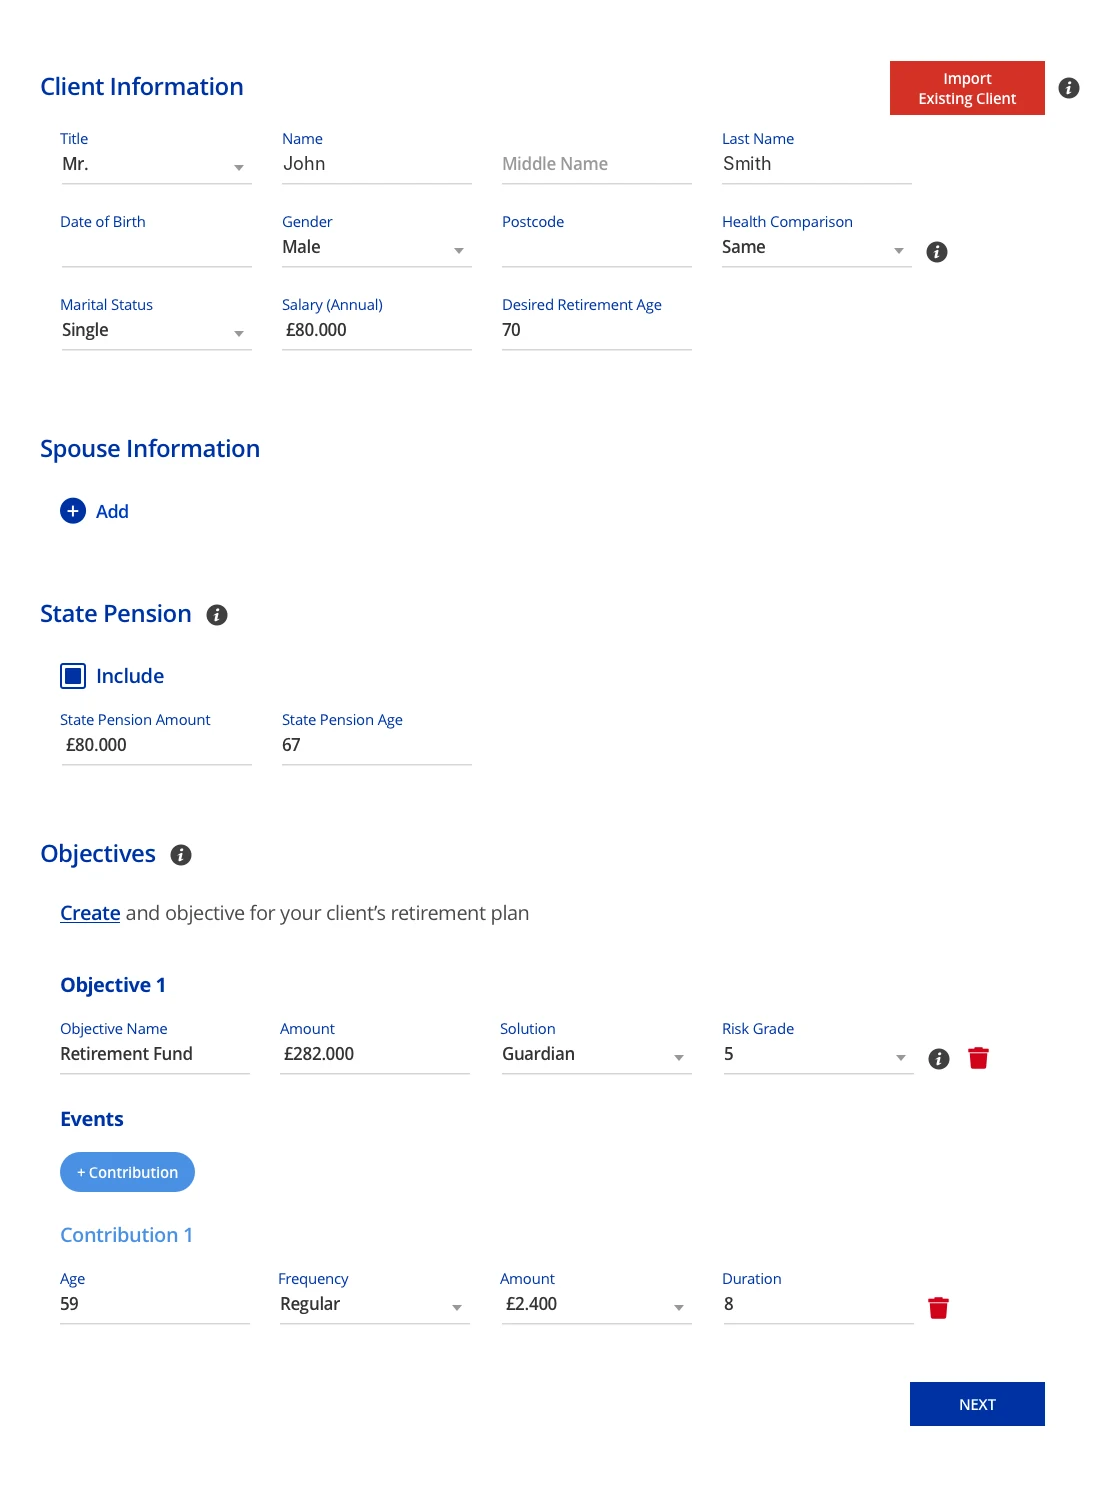
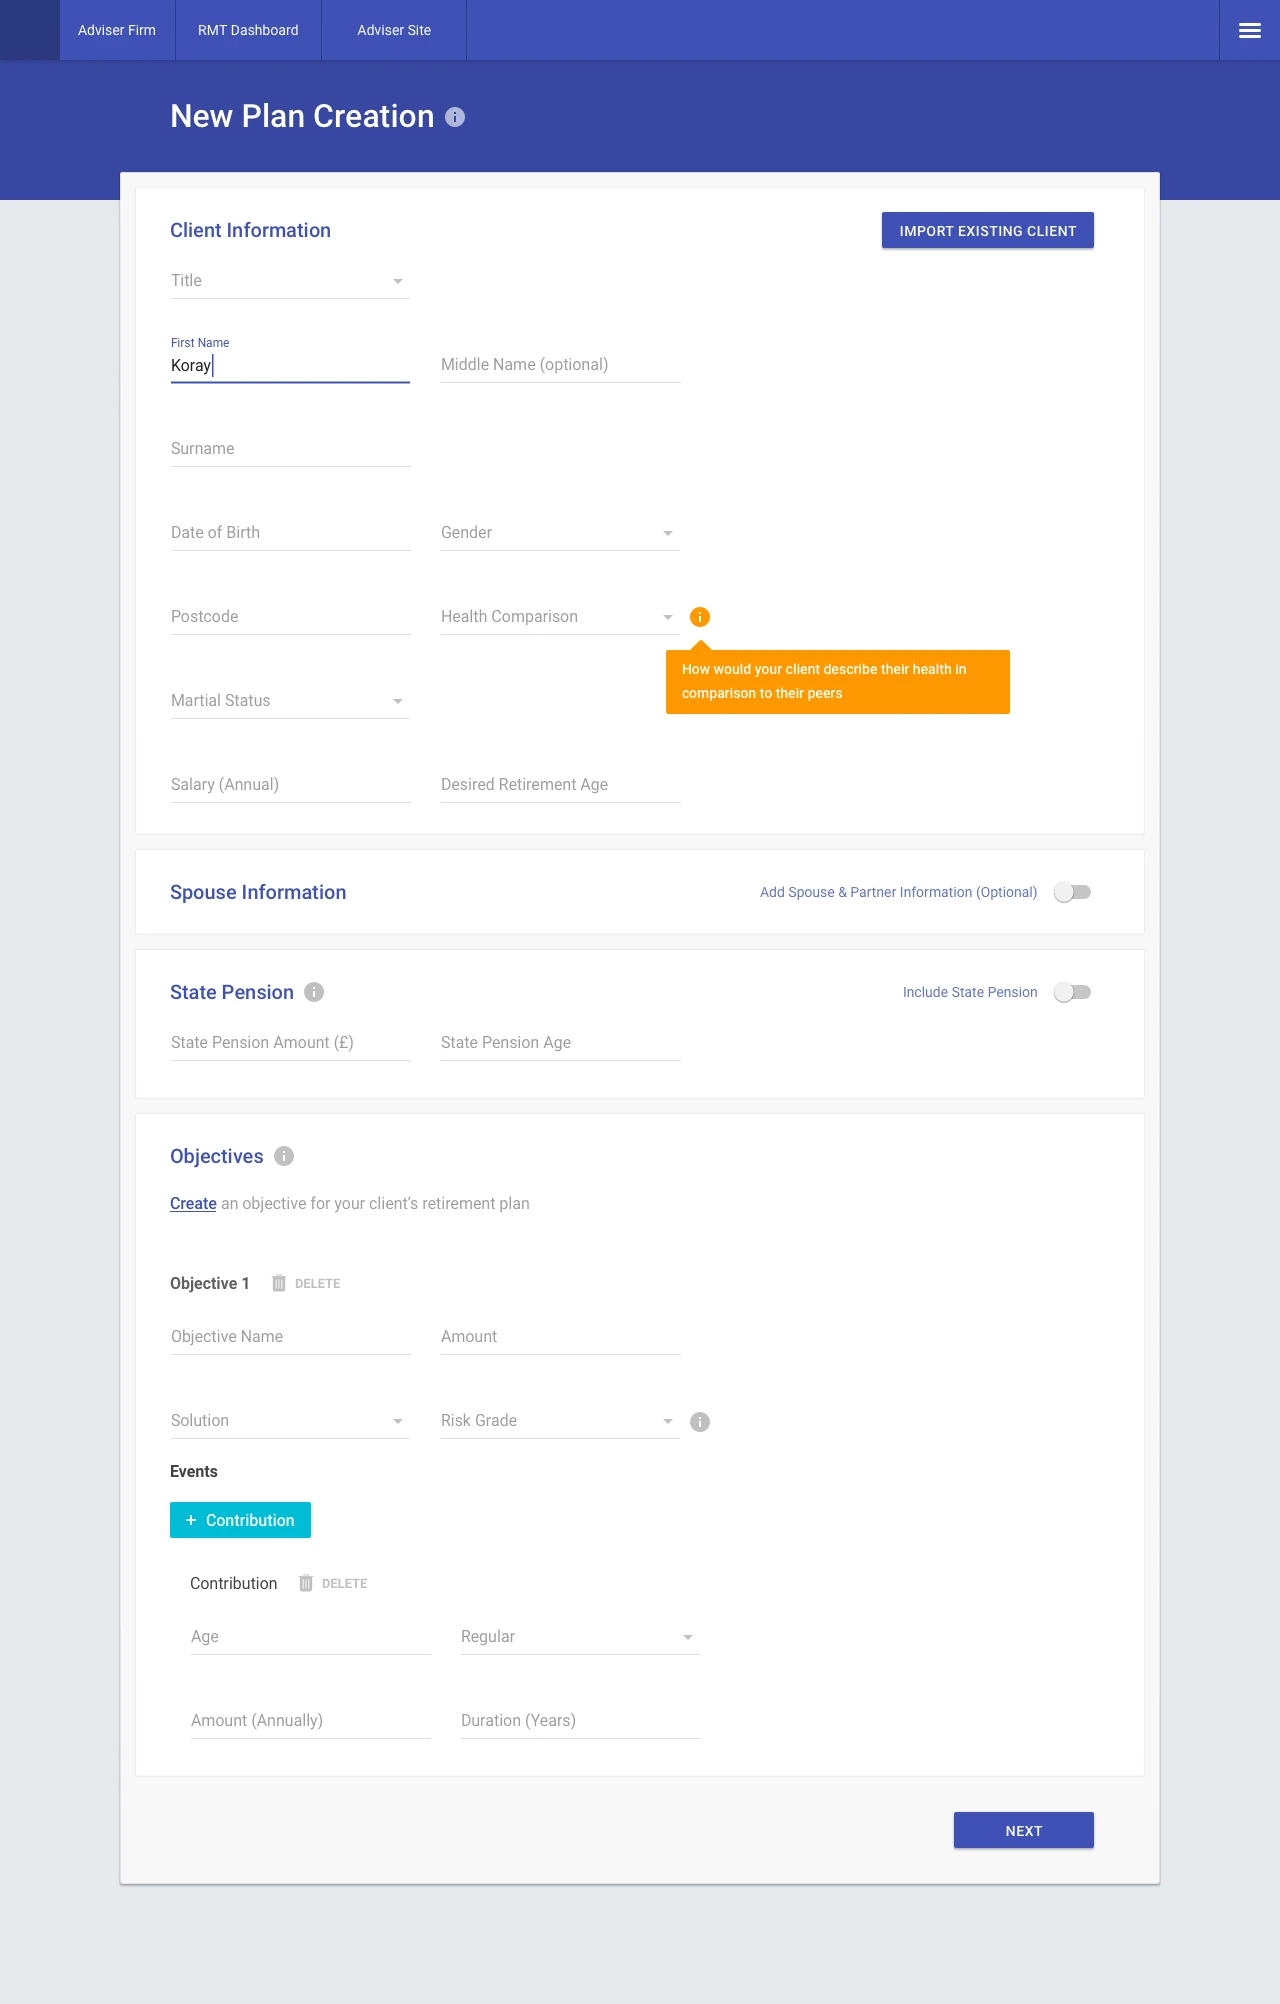
The second prototype’s new plan form takes a spouse or partner and the state pension on the same page as the client’s objectives.
Visual design
Keeping the graph readable.
The graph was the hardest part. It had to carry pots, events, ages and probability at once and still read in a few seconds, so colour carried meaning and everything else stepped back.
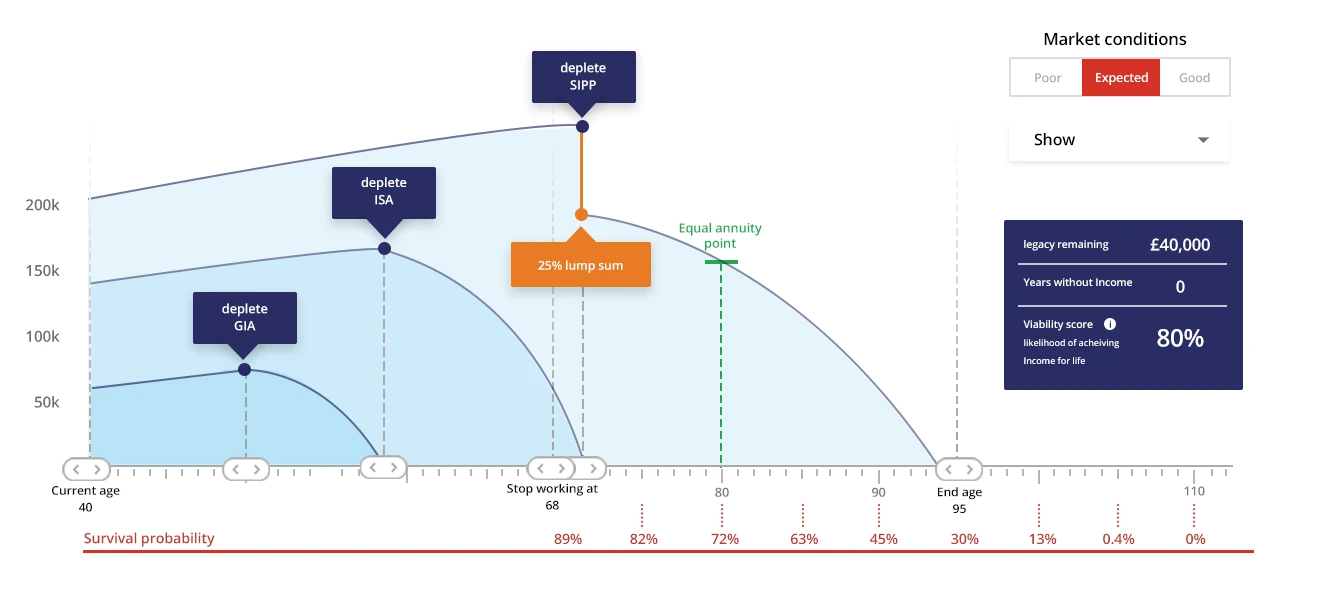
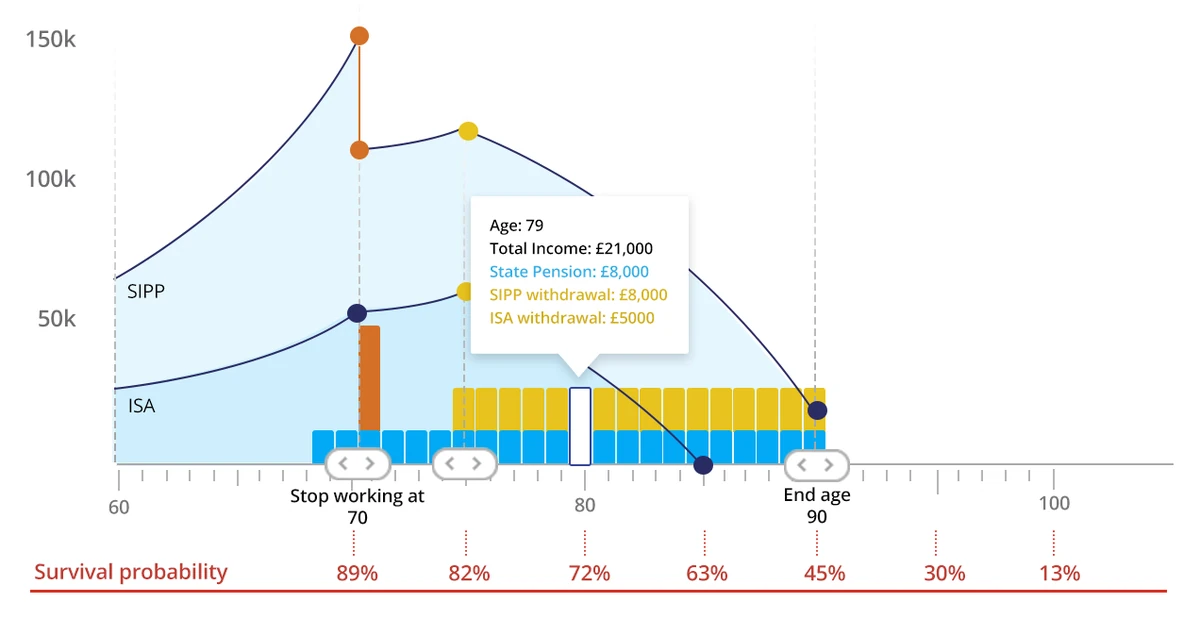
Advisers also told us that red, amber and green already mean something in their world, a case in trouble or a case going well, so colour on a plan’s status had to be chosen with care.
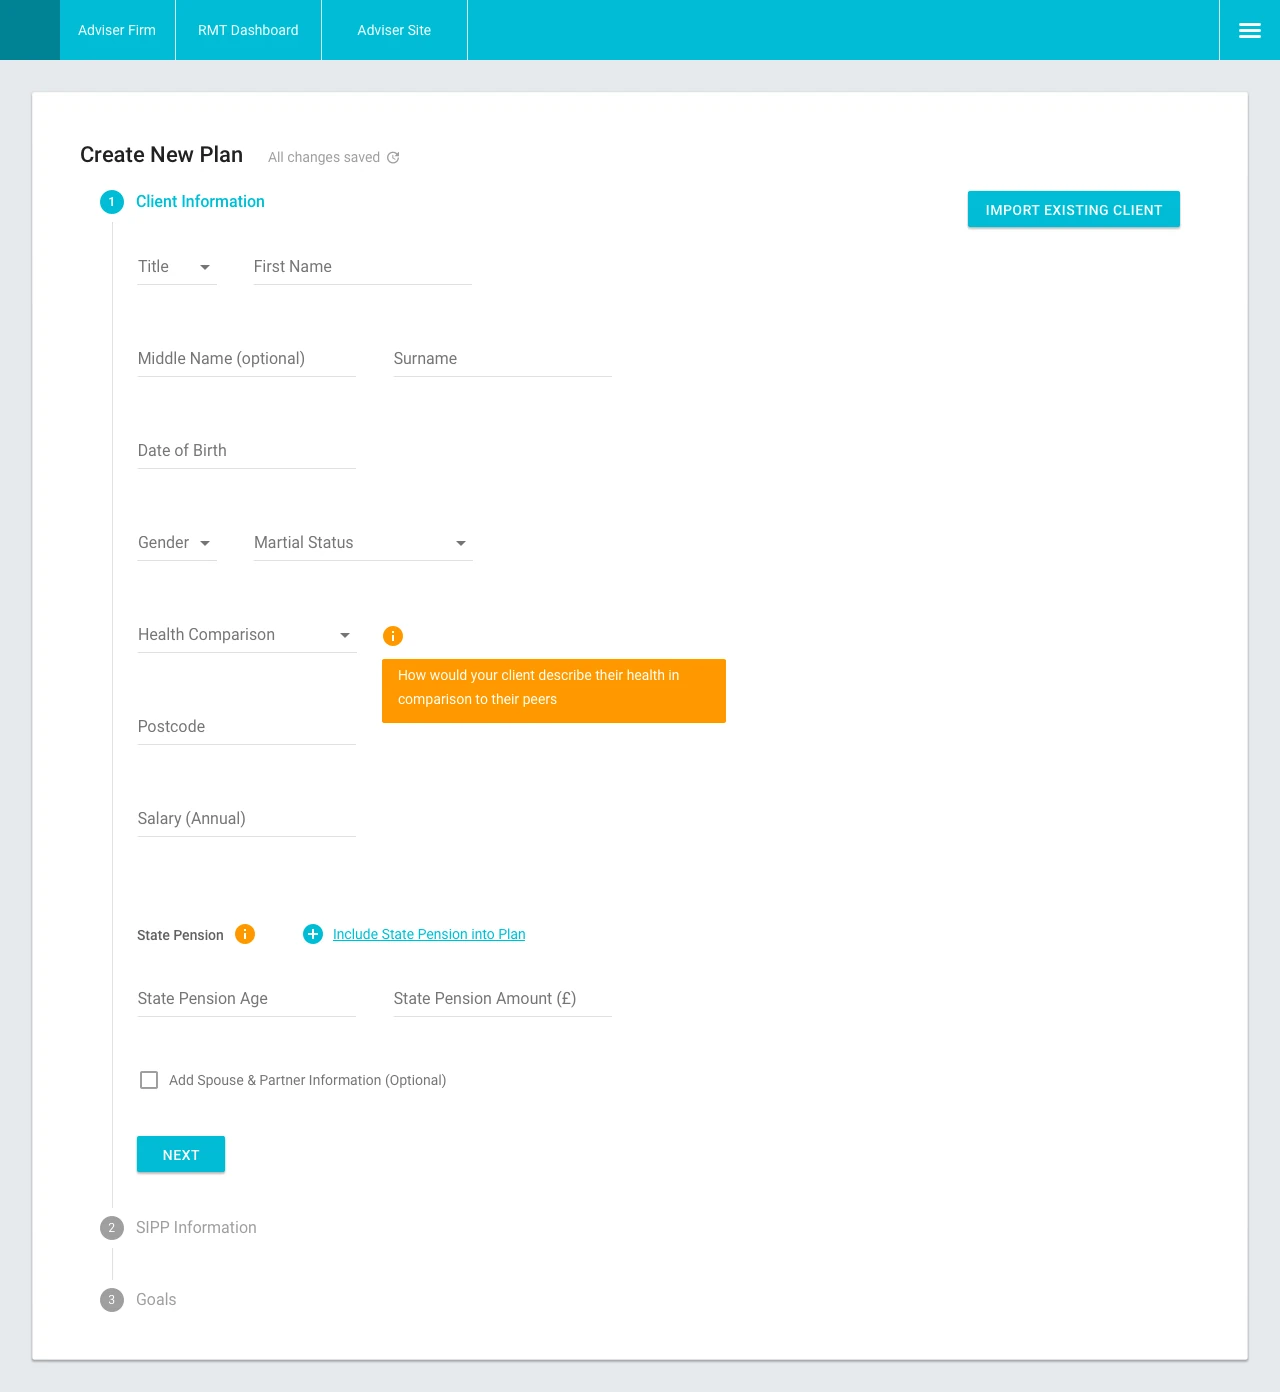
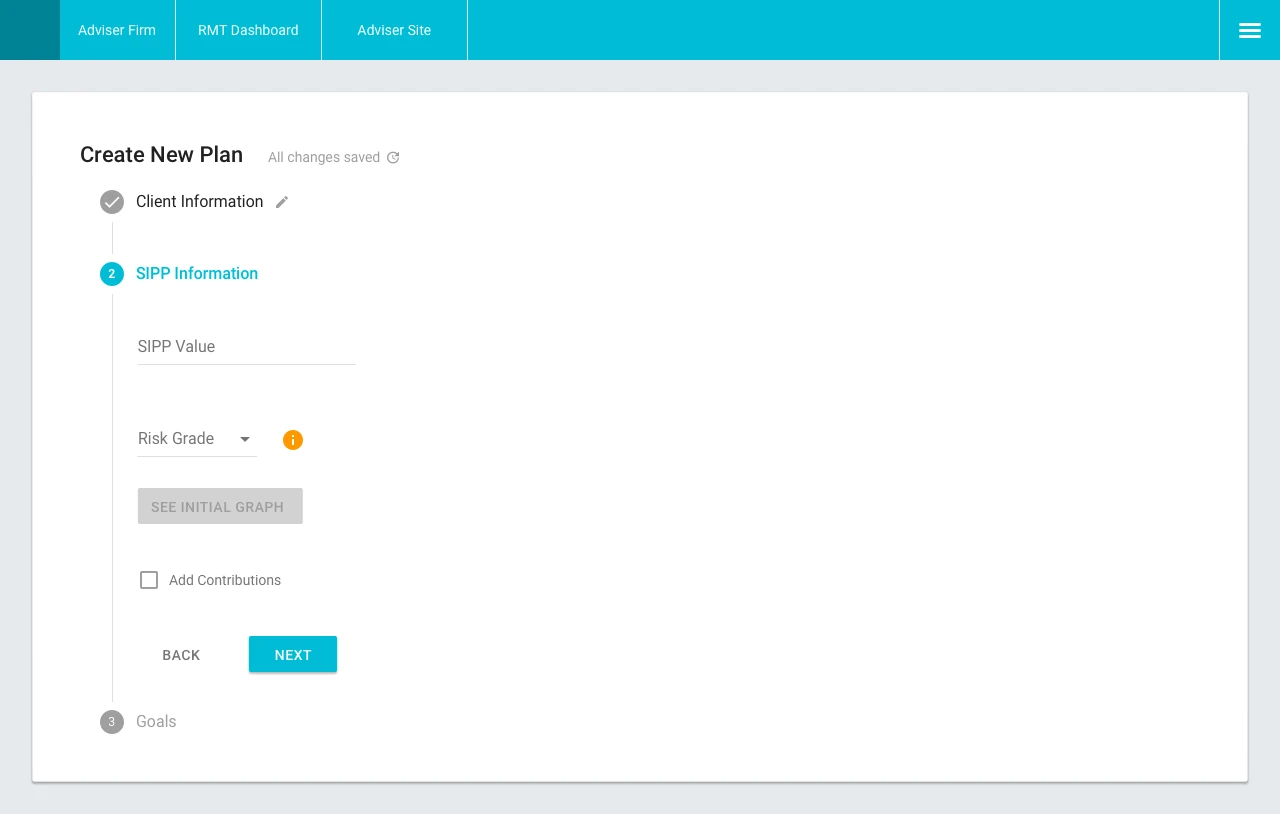
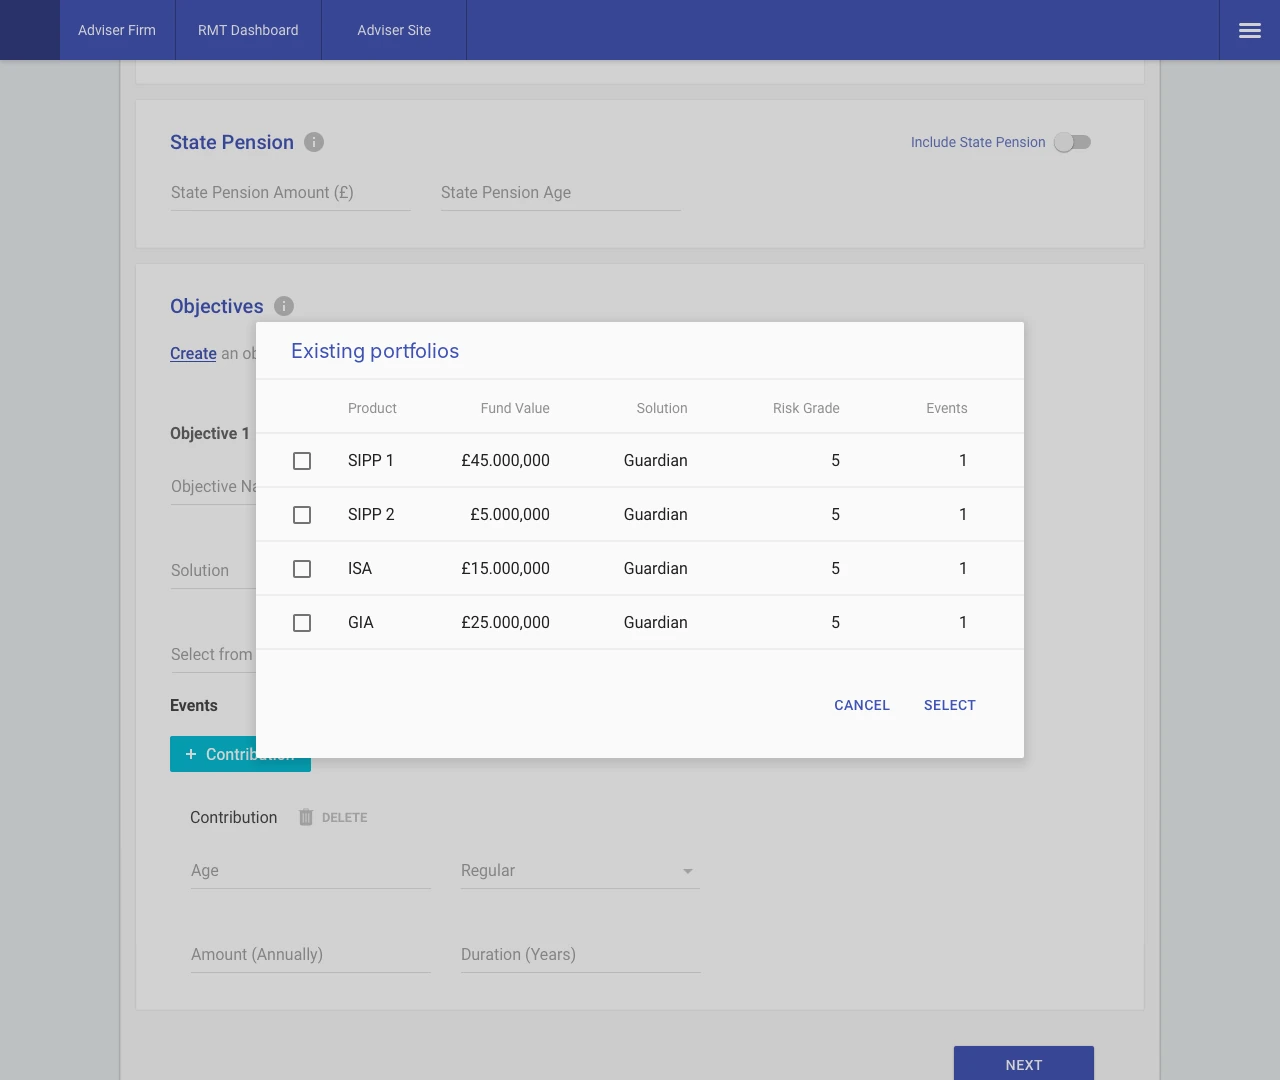
The visual design ran alongside the wireframes in two rounds: first a light, guided form, then a fuller layout for importing a client’s existing portfolios.
What didn’t land
Tax came up at every firm, and the first build left it out.
“The simpler it is, the better it is for client engagement but the worse it is for the Para Planners & Advisers to create a realistic scenario.”
Inflation came up at two firms. The scope agreed for the first build left out tax, joint pots and stacking several pots on one plan.
Lessons
What I took away.
Show your working. People trust a number when they can see what it is made of.
Test the conversation, not only the screen. How an adviser said they would explain a number to a client taught us more than any single click.
The final screens
The first and second prototypes.
Afterwards
The tool went live as Parmenion’s Retirement Income Manager Tool, built with Hymans Robertson. The viability score and probability-based outcomes are at its centre.